33
/
AIzaSyB4mHJ5NPEv-XzF7P6NDYXjlkCWaeKw5bc
November 30, 2025
114332
Cote d'Ivoire
CIV
true
2
1
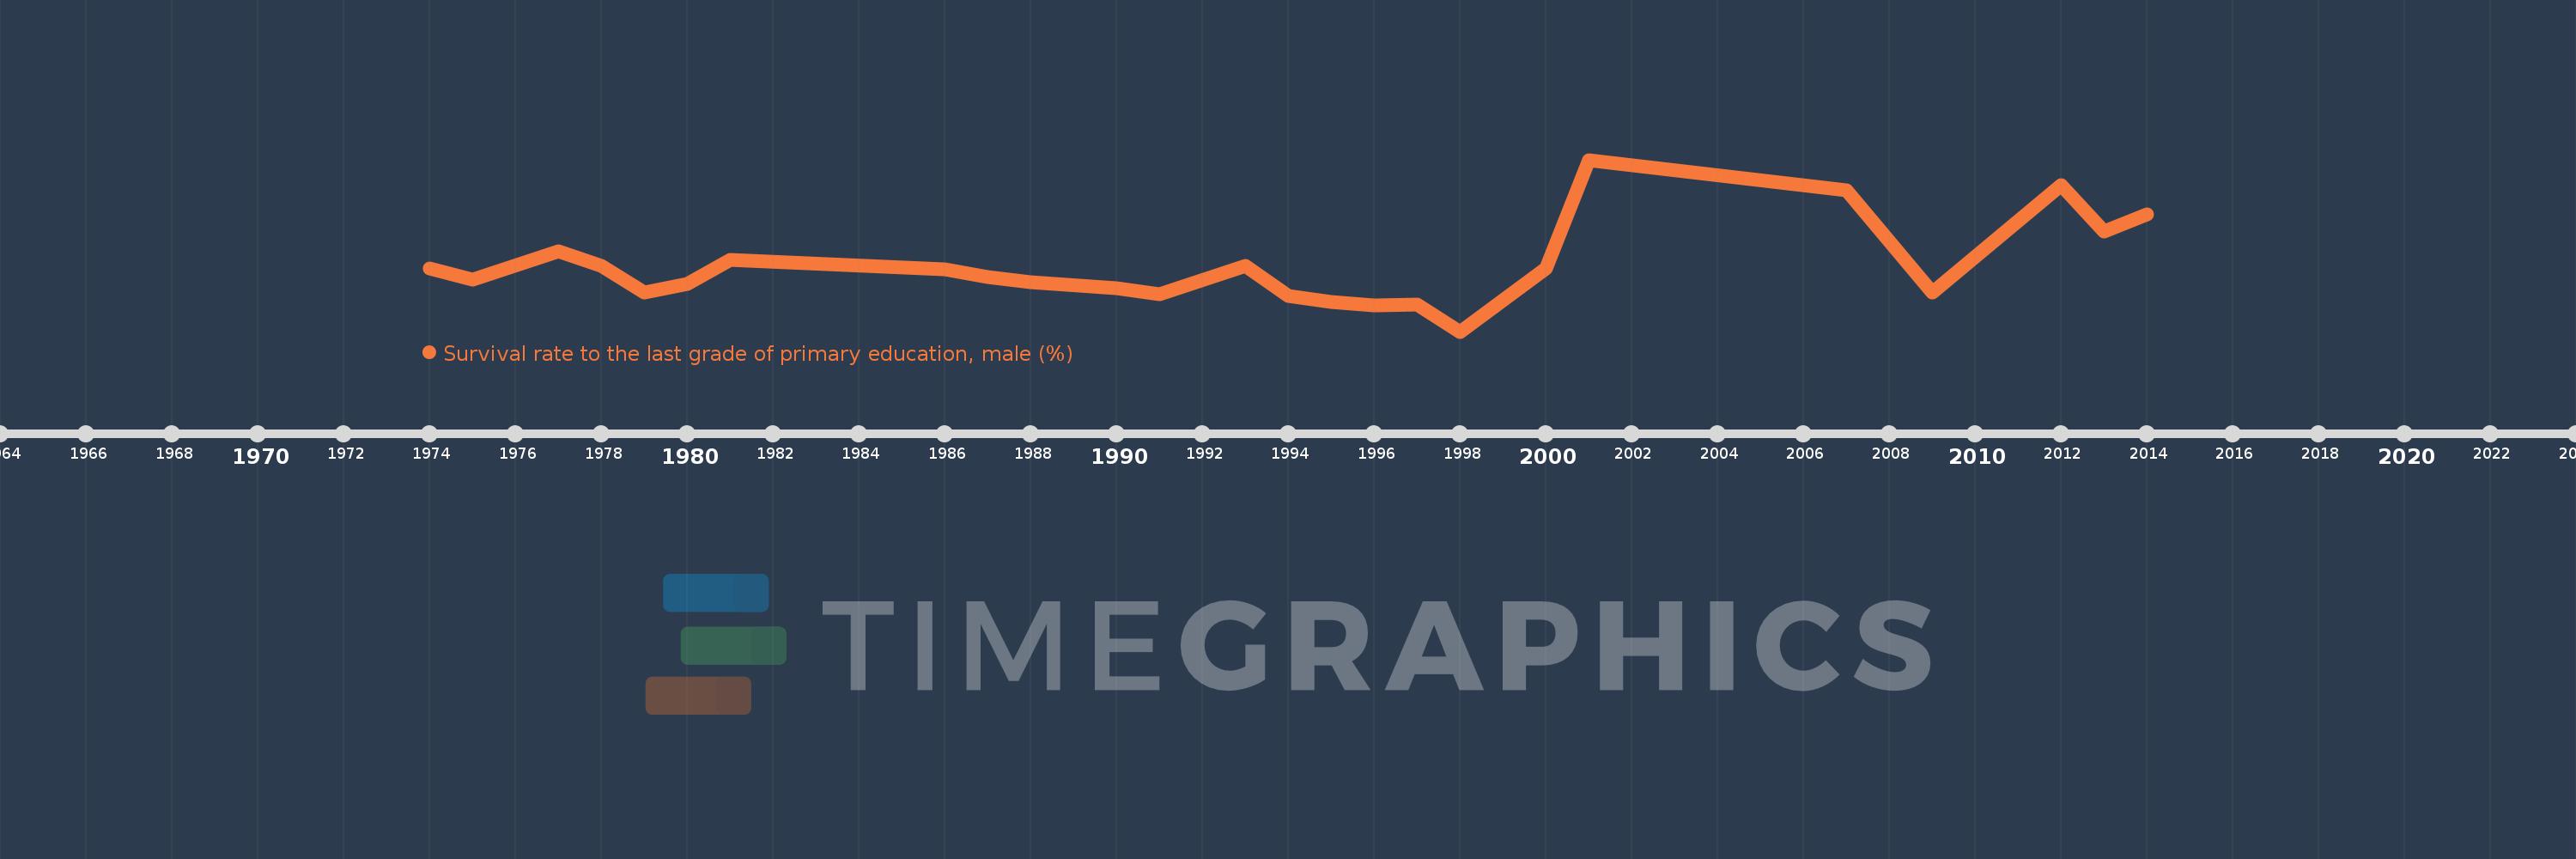
Survival rate to the last grade of primary education, male (%)
2014,2013,2012,2009,2007,2001,2000,1998,1997,1996,1995,1994,1993,1991,1990,1988,1987,1986,1981,1980,1979,1978,1977,1975,1974