33
/
AIzaSyB4mHJ5NPEv-XzF7P6NDYXjlkCWaeKw5bc
November 30, 2025
111660
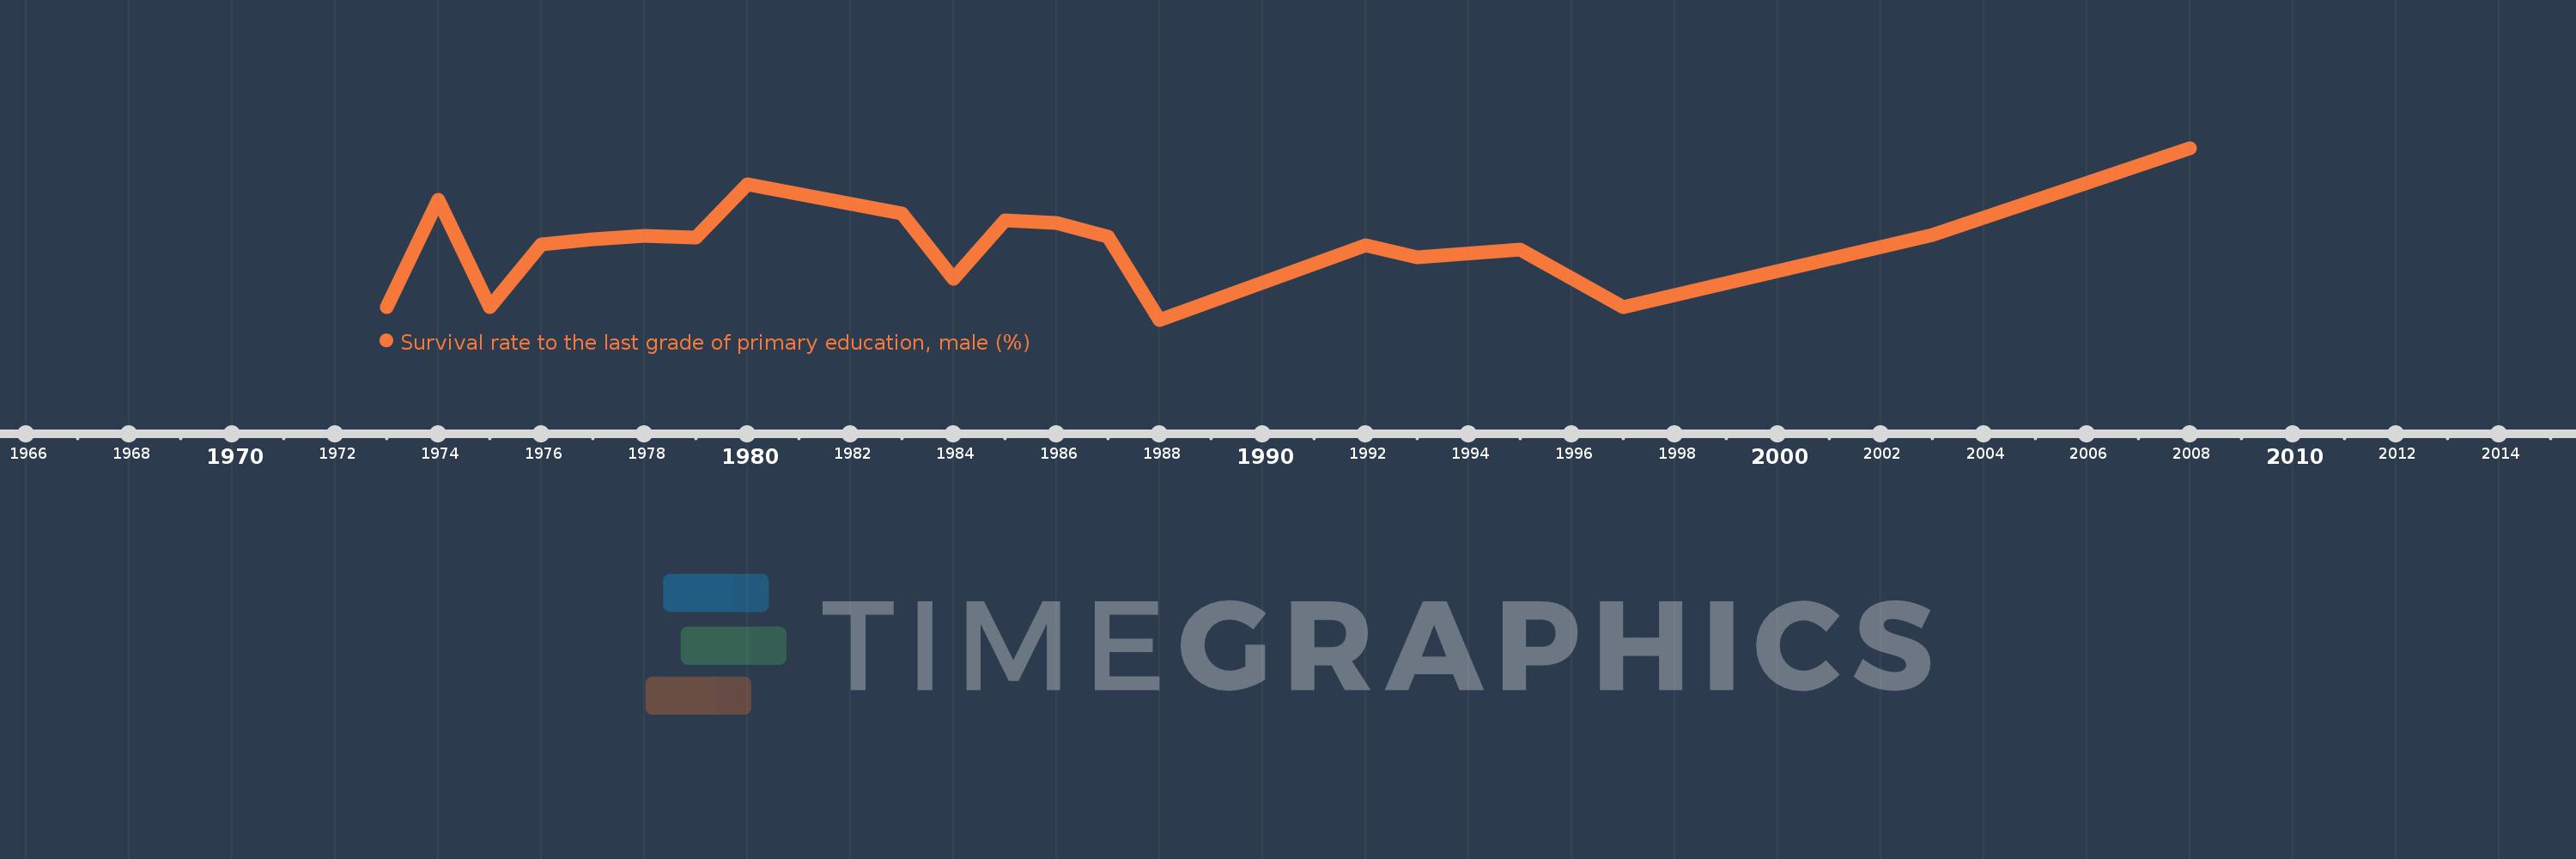
Congo, Rep.
COG
true
2
1
Survival rate to the last grade of primary education, male (%)
2008,2003,1997,1995,1993,1992,1988,1987,1986,1985,1984,1983,1980,1979,1978,1977,1976,1975,1974,1973