33
/
AIzaSyB4mHJ5NPEv-XzF7P6NDYXjlkCWaeKw5bc
November 30, 2025
104269
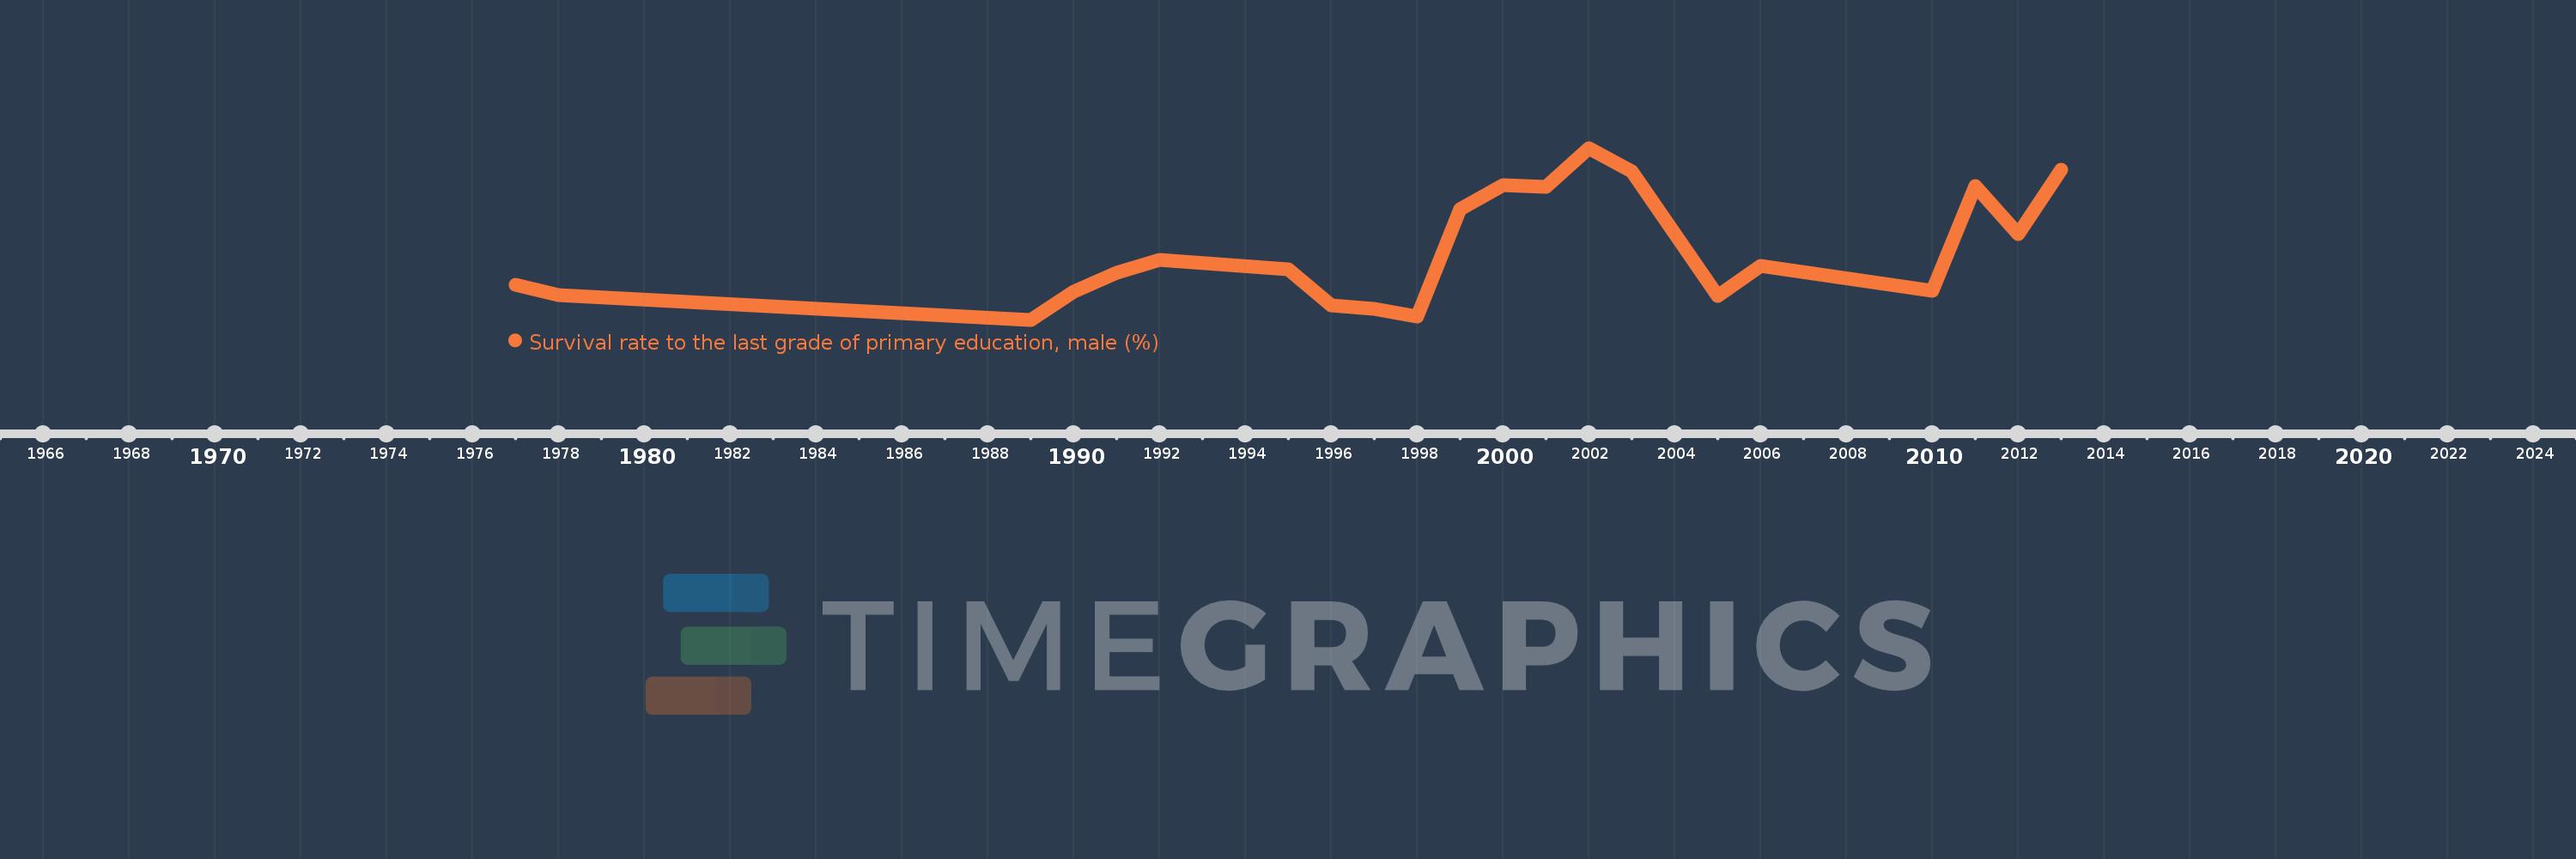
Chad
TCD
true
2
1
Survival rate to the last grade of primary education, male (%)
2013,2012,2011,2010,2006,2005,2003,2002,2001,2000,1999,1998,1997,1996,1995,1992,1991,1990,1989,1978,1977