33
/
AIzaSyB4mHJ5NPEv-XzF7P6NDYXjlkCWaeKw5bc
November 30, 2025
103084
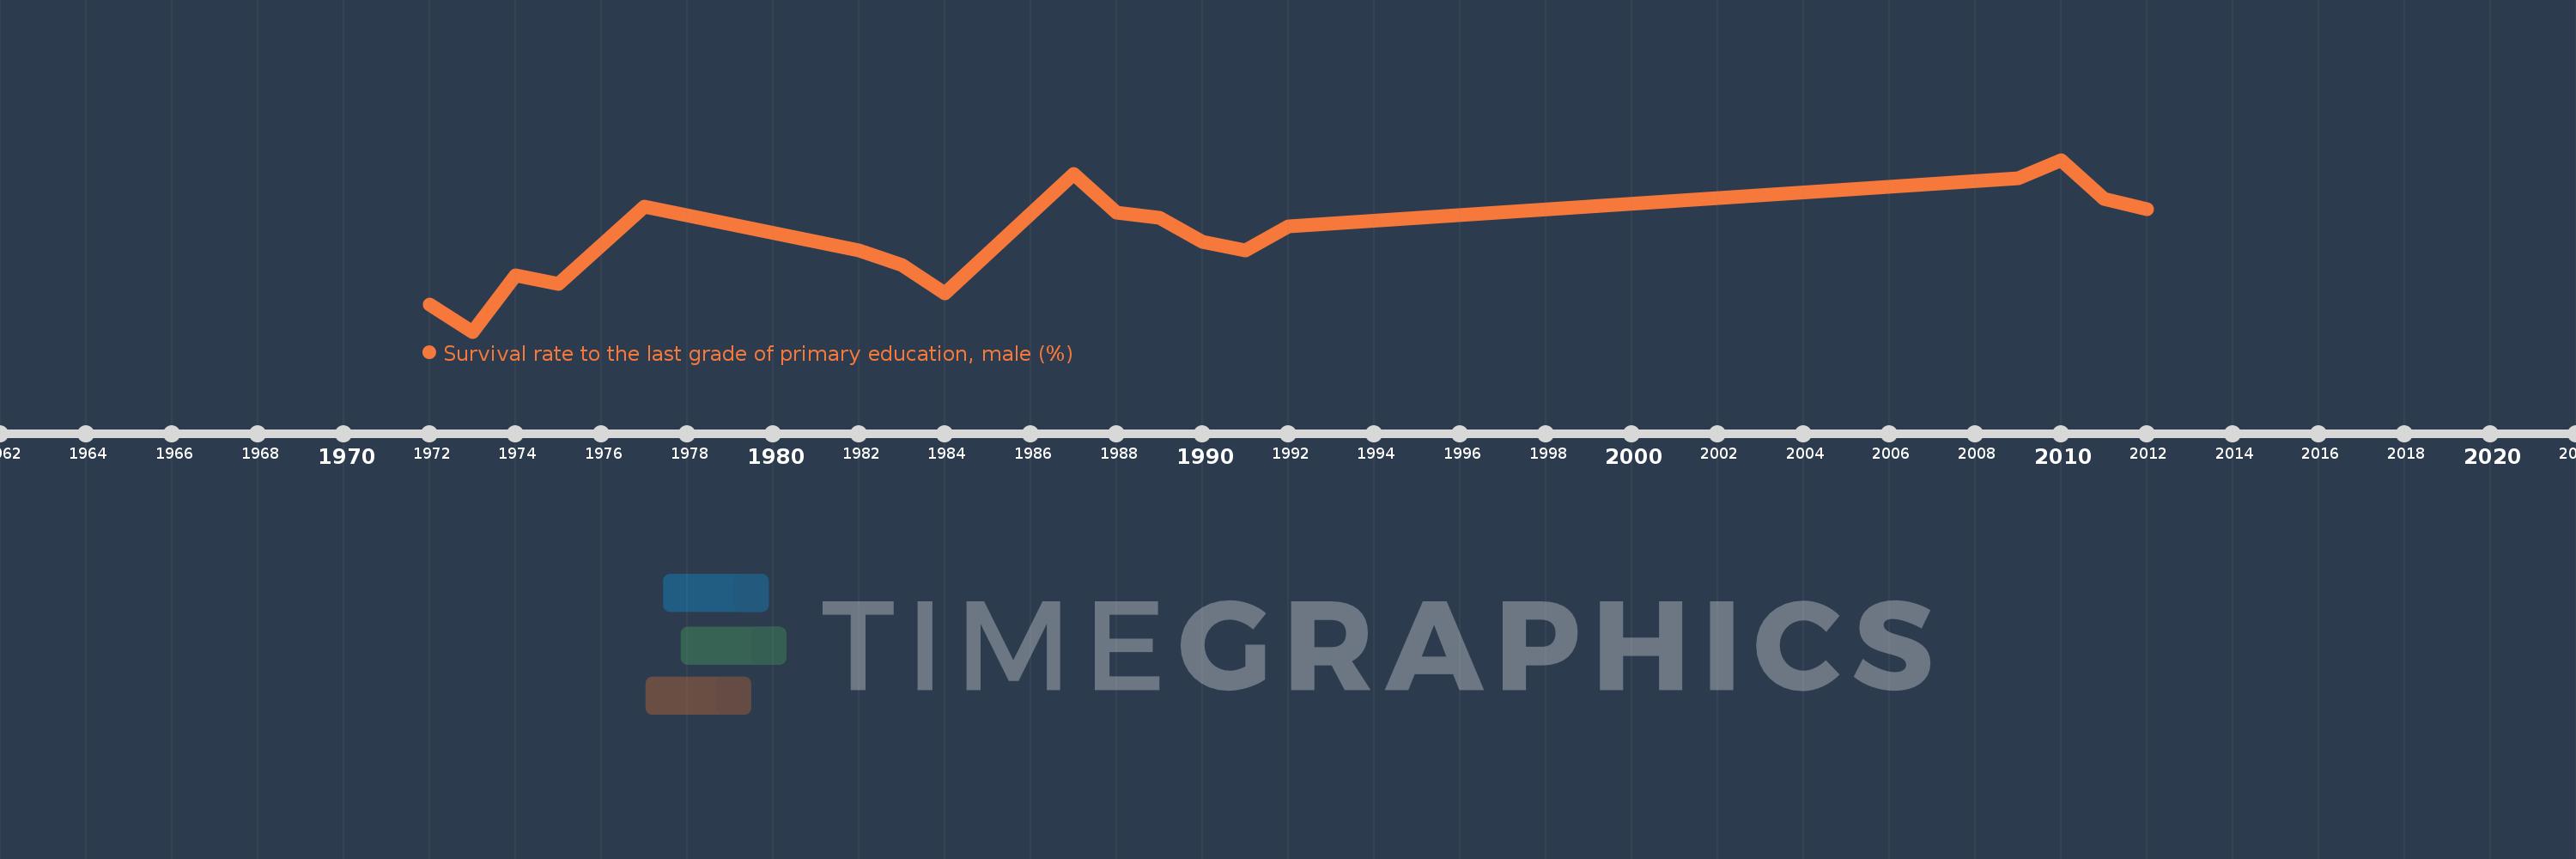
Central African Republic
CAF
true
2
1
Survival rate to the last grade of primary education, male (%)
2012,2011,2010,2009,1992,1991,1990,1989,1988,1987,1984,1983,1982,1977,1975,1974,1973,1972