33
/pt/
AIzaSyAYiBZKx7MnpbEhh9jyipgxe19OcubqV5w
August 1, 2025
62219
Upper middle income
UMC
false
2
1
Stocks traded, total value (% of GDP)
2016,2015,2014,2013,2012,2011,2010,2009,2008,2007,2006,2005,2004,2003,2002,2001,2000,1999,1998,1997,1996,1995,1994
Download
Biblioteca de estatísticas globais →Upper middle income →

Stocks traded, total value (% of GDP)

Estas estatísticas em outros países:

Arab WorldArgentinaArmeniaAustraliaAustriaBahrainBangladeshBarbadosBelgiumBermudaBoliviaBotswanaBrazilBulgariaCanadaCayman IslandsCentral Europe and the BalticsChannel IslandsChileChinaColombiaCosta RicaCote d'IvoireCroatiaCyprusCzech RepublicDenmarkEarly-demographic dividendEast Asia & PacificEast Asia & Pacific (excluding high income)East Asia & Pacific (IDA & IBRD countries)EcuadorEgypt, Arab Rep.El SalvadorEstoniaEuro areaEurope & Central AsiaEurope & Central Asia (excluding high income)Europe & Central Asia (IDA & IBRD countries)European UnionFijiFinlandFranceGeorgiaGermanyGhanaGreeceGuyanaHigh incomeHong Kong SAR, ChinaHungaryIBRD onlyIcelandIDA & IBRD totalIDA blendIDA totalIndiaIndonesiaIran, Islamic Rep.IrelandIsraelItalyJamaicaJapanJordanKazakhstanKenyaKorea, Rep.KuwaitKyrgyz RepublicLate-demographic dividendLatin America & Caribbean Latin America & Caribbean (excluding high income)Latin America & the Caribbean (IDA & IBRD countries)LatviaLebanonLithuaniaLow & middle incomeLower middle incomeLuxembourgMacedonia, FYRMalawiMalaysiaMaltaMauritiusMexicoMiddle East & North AfricaMiddle East & North Africa (excluding high income)Middle East & North Africa (IDA & IBRD countries)Middle incomeMoldovaMongoliaMontenegroMoroccoNamibiaNetherlandsNew ZealandNigeriaNorth AmericaNorwayOECD membersOmanOther small statesPakistanPanamaPapua New GuineaParaguayPeruPhilippinesPolandPortugalPost-demographic dividendQatarRomaniaRussian FederationSaudi ArabiaSerbiaSeychellesSingaporeSlovak RepublicSloveniaSouth AfricaSouth AsiaSouth Asia (IDA & IBRD)SpainSri LankaSt. Kitts and NevisSub-Saharan Africa Sub-Saharan Africa (excluding high income)Sub-Saharan Africa (IDA & IBRD countries)SwazilandSwedenSwitzerlandTanzaniaThailandTrinidad and TobagoTunisiaTurkeyUgandaUkraineUnited Arab EmiratesUnited KingdomUnited StatesUpper middle incomeUruguayUzbekistanVenezuela, RBVietnamWest Bank and GazaWorldZambiaZimbabwe

Linha do tempo:

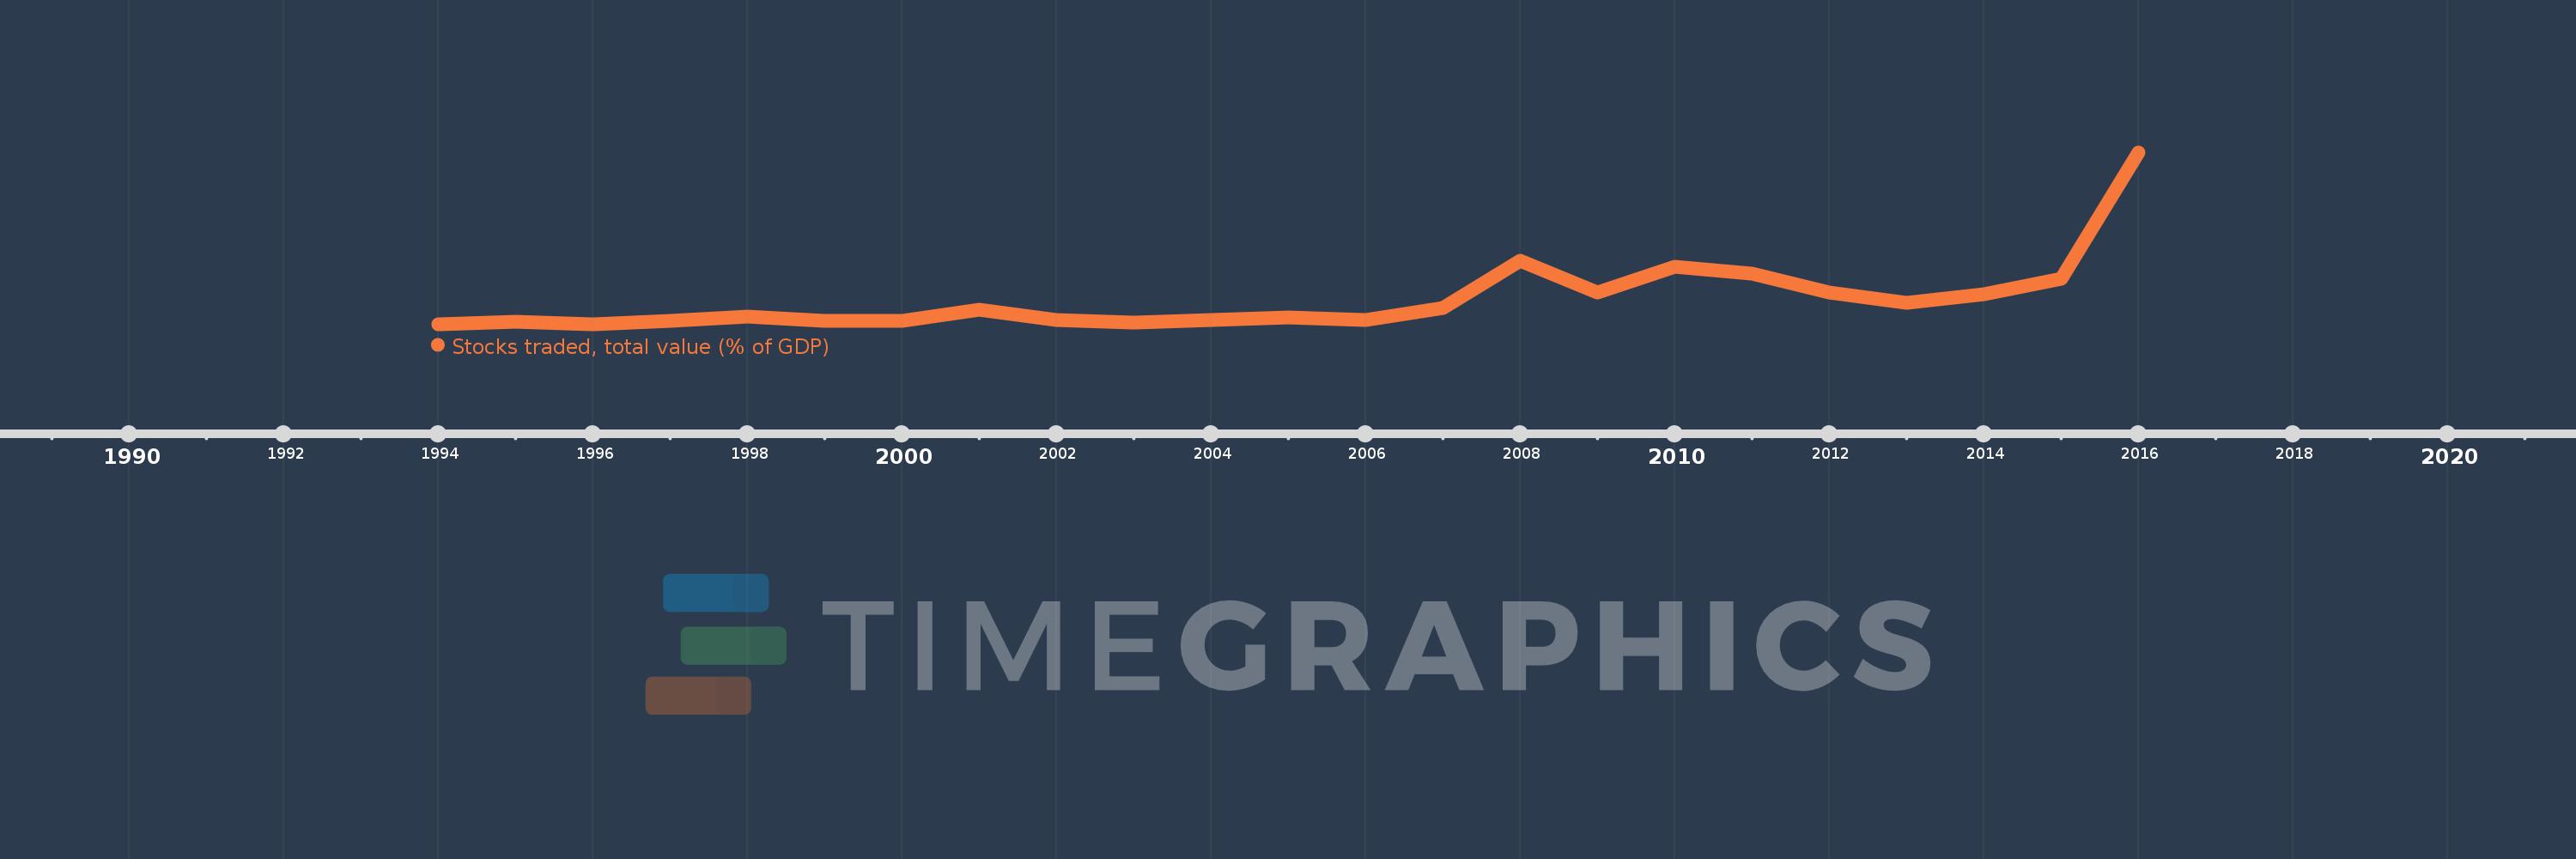
Nesta escala de tempo está apresentado um gráfico de 1994 ano até 2016 ano Upper middle income. Dados de 1993 ano ausente. O número de observações reais por data: 23.

Fonte (nome):

Indicadores de desenvolvimento mundial

Fonte (organização):

World Federation of Exchanges database.

Categorias:

Financial Sector

Foi atualizado:

23 abr 2017 ano

Indicadores de alterações dos valores ao longo dos anos

Em média:
43.929
Mínimo:
13.333
1 jan 1996 ano
Máximo:
224.056
1 jan 2016 ano
Na data de observação
Valor
Mudança absoluta
A alteração em relação ao valor anterior
1 jan 1994 ano
13.336
+13.336
0.0%
1 jan 1995 ano
16.716
+3.38
25.35%
1 jan 1996 ano
13.333
-3.383
-20.24%
1 jan 1997 ano
17.5
+4.167
31.25%
1 jan 1998 ano
22.28
+4.78
27.31%
1 jan 1999 ano
17.802
-4.477
-20.1%
1 jan 2000 ano
17.386
-0.416
-2.34%
1 jan 2001 ano
30.699
+13.313
76.57%
1 jan 2002 ano
18.038
-12.661
-41.24%
1 jan 2003 ano
14.81
-3.229
-17.9%
1 jan 2004 ano
18.336
+3.526
23.81%
1 jan 2005 ano
21.354
+3.018
16.46%
1 jan 2006 ano
18.488
-2.866
-13.42%
1 jan 2007 ano
33.557
+15.069
81.5%
1 jan 2008 ano
91.601
+58.044
172.97%
1 jan 2009 ano
51.969
-39.632
-43.27%
1 jan 2010 ano
83.342
+31.373
60.37%
1 jan 2011 ano
74.895
-8.447
-10.14%
1 jan 2012 ano
51.999
-22.896
-30.57%
1 jan 2013 ano
39.27
-12.729
-24.48%
1 jan 2014 ano
50.447
+11.177
28.46%
1 jan 2015 ano
69.145
+18.697
37.06%
1 jan 2016 ano
224.056
+154.911
224.04%

Classificação de países por estatísticas atuais por anos