33
/pt/
AIzaSyAYiBZKx7MnpbEhh9jyipgxe19OcubqV5w
August 1, 2025
194953
Mauritius
MUS
true
2
1
Stocks traded, total value (% of GDP)
2016,2015,2014,2013,2012,2011,2010,2009,2008,2007,2006,2005,2004,2003,2002,2001,2000,1999,1998,1997,1996,1995,1994
Download
Biblioteca de estatísticas globais →Mauritius →

Stocks traded, total value (% of GDP)

Estas estatísticas em outros países:

Arab WorldArgentinaArmeniaAustraliaAustriaBahrainBangladeshBarbadosBelgiumBermudaBoliviaBotswanaBrazilBulgariaCanadaCayman IslandsCentral Europe and the BalticsChannel IslandsChileChinaColombiaCosta RicaCote d'IvoireCroatiaCyprusCzech RepublicDenmarkEarly-demographic dividendEast Asia & PacificEast Asia & Pacific (excluding high income)East Asia & Pacific (IDA & IBRD countries)EcuadorEgypt, Arab Rep.El SalvadorEstoniaEuro areaEurope & Central AsiaEurope & Central Asia (excluding high income)Europe & Central Asia (IDA & IBRD countries)European UnionFijiFinlandFranceGeorgiaGermanyGhanaGreeceGuyanaHigh incomeHong Kong SAR, ChinaHungaryIBRD onlyIcelandIDA & IBRD totalIDA blendIDA totalIndiaIndonesiaIran, Islamic Rep.IrelandIsraelItalyJamaicaJapanJordanKazakhstanKenyaKorea, Rep.KuwaitKyrgyz RepublicLate-demographic dividendLatin America & Caribbean Latin America & Caribbean (excluding high income)Latin America & the Caribbean (IDA & IBRD countries)LatviaLebanonLithuaniaLow & middle incomeLower middle incomeLuxembourgMacedonia, FYRMalawiMalaysiaMaltaMauritiusMexicoMiddle East & North AfricaMiddle East & North Africa (excluding high income)Middle East & North Africa (IDA & IBRD countries)Middle incomeMoldovaMongoliaMontenegroMoroccoNamibiaNetherlandsNew ZealandNigeriaNorth AmericaNorwayOECD membersOmanOther small statesPakistanPanamaPapua New GuineaParaguayPeruPhilippinesPolandPortugalPost-demographic dividendQatarRomaniaRussian FederationSaudi ArabiaSerbiaSeychellesSingaporeSlovak RepublicSloveniaSouth AfricaSouth AsiaSouth Asia (IDA & IBRD)SpainSri LankaSt. Kitts and NevisSub-Saharan Africa Sub-Saharan Africa (excluding high income)Sub-Saharan Africa (IDA & IBRD countries)SwazilandSwedenSwitzerlandTanzaniaThailandTrinidad and TobagoTunisiaTurkeyUgandaUkraineUnited Arab EmiratesUnited KingdomUnited StatesUpper middle incomeUruguayUzbekistanVenezuela, RBVietnamWest Bank and GazaWorldZambiaZimbabwe

Linha do tempo:

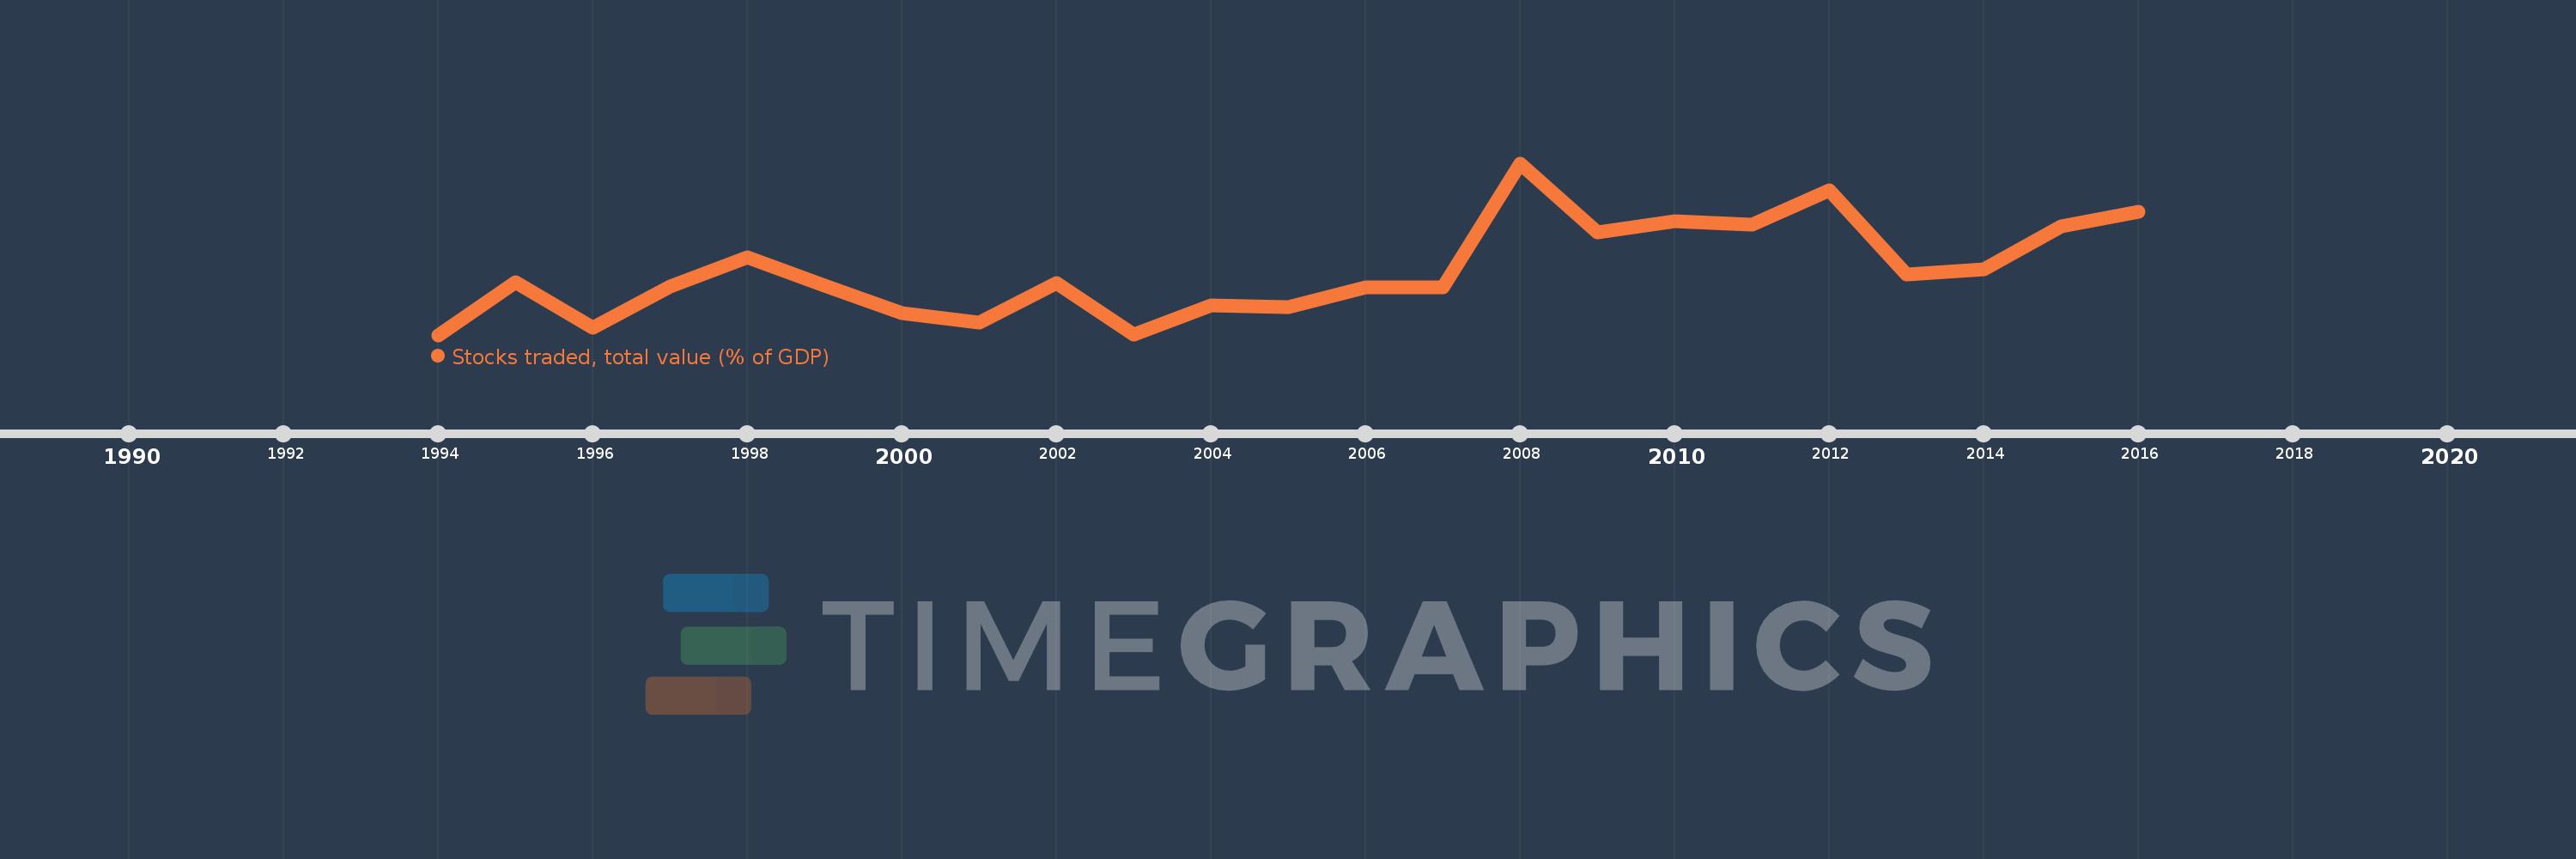
Nesta escala de tempo está apresentado um gráfico de 1994 ano até 2016 ano Mauritius. Dados de 1993 ano ausente. O número de observações reais por data: 23.

Fonte (nome):

Indicadores de desenvolvimento mundial

Fonte (organização):

World Federation of Exchanges database.

Categorias:

Financial Sector

Foi atualizado:

23 abr 2017 ano

Indicadores de alterações dos valores ao longo dos anos

Em média:
2.607
Mínimo:
1.15
1 jan 1994 ano
Máximo:
5.052
1 jan 2008 ano
Na data de observação
Valor
Mudança absoluta
A alteração em relação ao valor anterior
1 jan 1994 ano
1.15
+1.15
0.0%
1 jan 1995 ano
2.345
+1.196
103.99%
1 jan 1996 ano
1.325
-1.02
-43.5%
1 jan 1997 ano
2.243
+0.918
69.28%
1 jan 1998 ano
2.917
+0.674
30.06%
1 jan 1999 ano
2.266
-0.652
-22.34%
1 jan 2000 ano
1.65
-0.616
-27.17%
1 jan 2001 ano
1.428
-0.223
-13.49%
1 jan 2002 ano
2.322
+0.895
62.67%
1 jan 2003 ano
1.154
-1.168
-50.29%
1 jan 2004 ano
1.83
+0.676
58.53%
1 jan 2005 ano
1.787
-0.043
-2.36%
1 jan 2006 ano
2.225
+0.438
24.51%
1 jan 2007 ano
2.232
+0.007
0.32%
1 jan 2008 ano
5.052
+2.821
126.38%
1 jan 2009 ano
3.49
-1.562
-30.92%
1 jan 2010 ano
3.727
+0.237
6.79%
1 jan 2011 ano
3.649
-0.079
-2.11%
1 jan 2012 ano
4.428
+0.779
21.36%
1 jan 2013 ano
2.535
-1.893
-42.74%
1 jan 2014 ano
2.649
+0.113
4.47%
1 jan 2015 ano
3.619
+0.97
36.63%
1 jan 2016 ano
3.945
+0.326
9.0%

Classificação de países por estatísticas atuais por anos