33
/pt/
AIzaSyAYiBZKx7MnpbEhh9jyipgxe19OcubqV5w
August 1, 2025
202319
Morocco
MAR
true
2
1
Stocks traded, total value (% of GDP)
2016,2015,2014,2013,2012,2011,2010,2009,2008,2007,2006,2005,2004,2003,2002,2001,2000,1999,1998,1997,1996,1995,1994
Download
Biblioteca de estatísticas globais →Morocco →

Stocks traded, total value (% of GDP)

Estas estatísticas em outros países:

Arab WorldArgentinaArmeniaAustraliaAustriaBahrainBangladeshBarbadosBelgiumBermudaBoliviaBotswanaBrazilBulgariaCanadaCayman IslandsCentral Europe and the BalticsChannel IslandsChileChinaColombiaCosta RicaCote d'IvoireCroatiaCyprusCzech RepublicDenmarkEarly-demographic dividendEast Asia & PacificEast Asia & Pacific (excluding high income)East Asia & Pacific (IDA & IBRD countries)EcuadorEgypt, Arab Rep.El SalvadorEstoniaEuro areaEurope & Central AsiaEurope & Central Asia (excluding high income)Europe & Central Asia (IDA & IBRD countries)European UnionFijiFinlandFranceGeorgiaGermanyGhanaGreeceGuyanaHigh incomeHong Kong SAR, ChinaHungaryIBRD onlyIcelandIDA & IBRD totalIDA blendIDA totalIndiaIndonesiaIran, Islamic Rep.IrelandIsraelItalyJamaicaJapanJordanKazakhstanKenyaKorea, Rep.KuwaitKyrgyz RepublicLate-demographic dividendLatin America & Caribbean Latin America & Caribbean (excluding high income)Latin America & the Caribbean (IDA & IBRD countries)LatviaLebanonLithuaniaLow & middle incomeLower middle incomeLuxembourgMacedonia, FYRMalawiMalaysiaMaltaMauritiusMexicoMiddle East & North AfricaMiddle East & North Africa (excluding high income)Middle East & North Africa (IDA & IBRD countries)Middle incomeMoldovaMongoliaMontenegroMoroccoNamibiaNetherlandsNew ZealandNigeriaNorth AmericaNorwayOECD membersOmanOther small statesPakistanPanamaPapua New GuineaParaguayPeruPhilippinesPolandPortugalPost-demographic dividendQatarRomaniaRussian FederationSaudi ArabiaSerbiaSeychellesSingaporeSlovak RepublicSloveniaSouth AfricaSouth AsiaSouth Asia (IDA & IBRD)SpainSri LankaSt. Kitts and NevisSub-Saharan Africa Sub-Saharan Africa (excluding high income)Sub-Saharan Africa (IDA & IBRD countries)SwazilandSwedenSwitzerlandTanzaniaThailandTrinidad and TobagoTunisiaTurkeyUgandaUkraineUnited Arab EmiratesUnited KingdomUnited StatesUpper middle incomeUruguayUzbekistanVenezuela, RBVietnamWest Bank and GazaWorldZambiaZimbabwe

Linha do tempo:

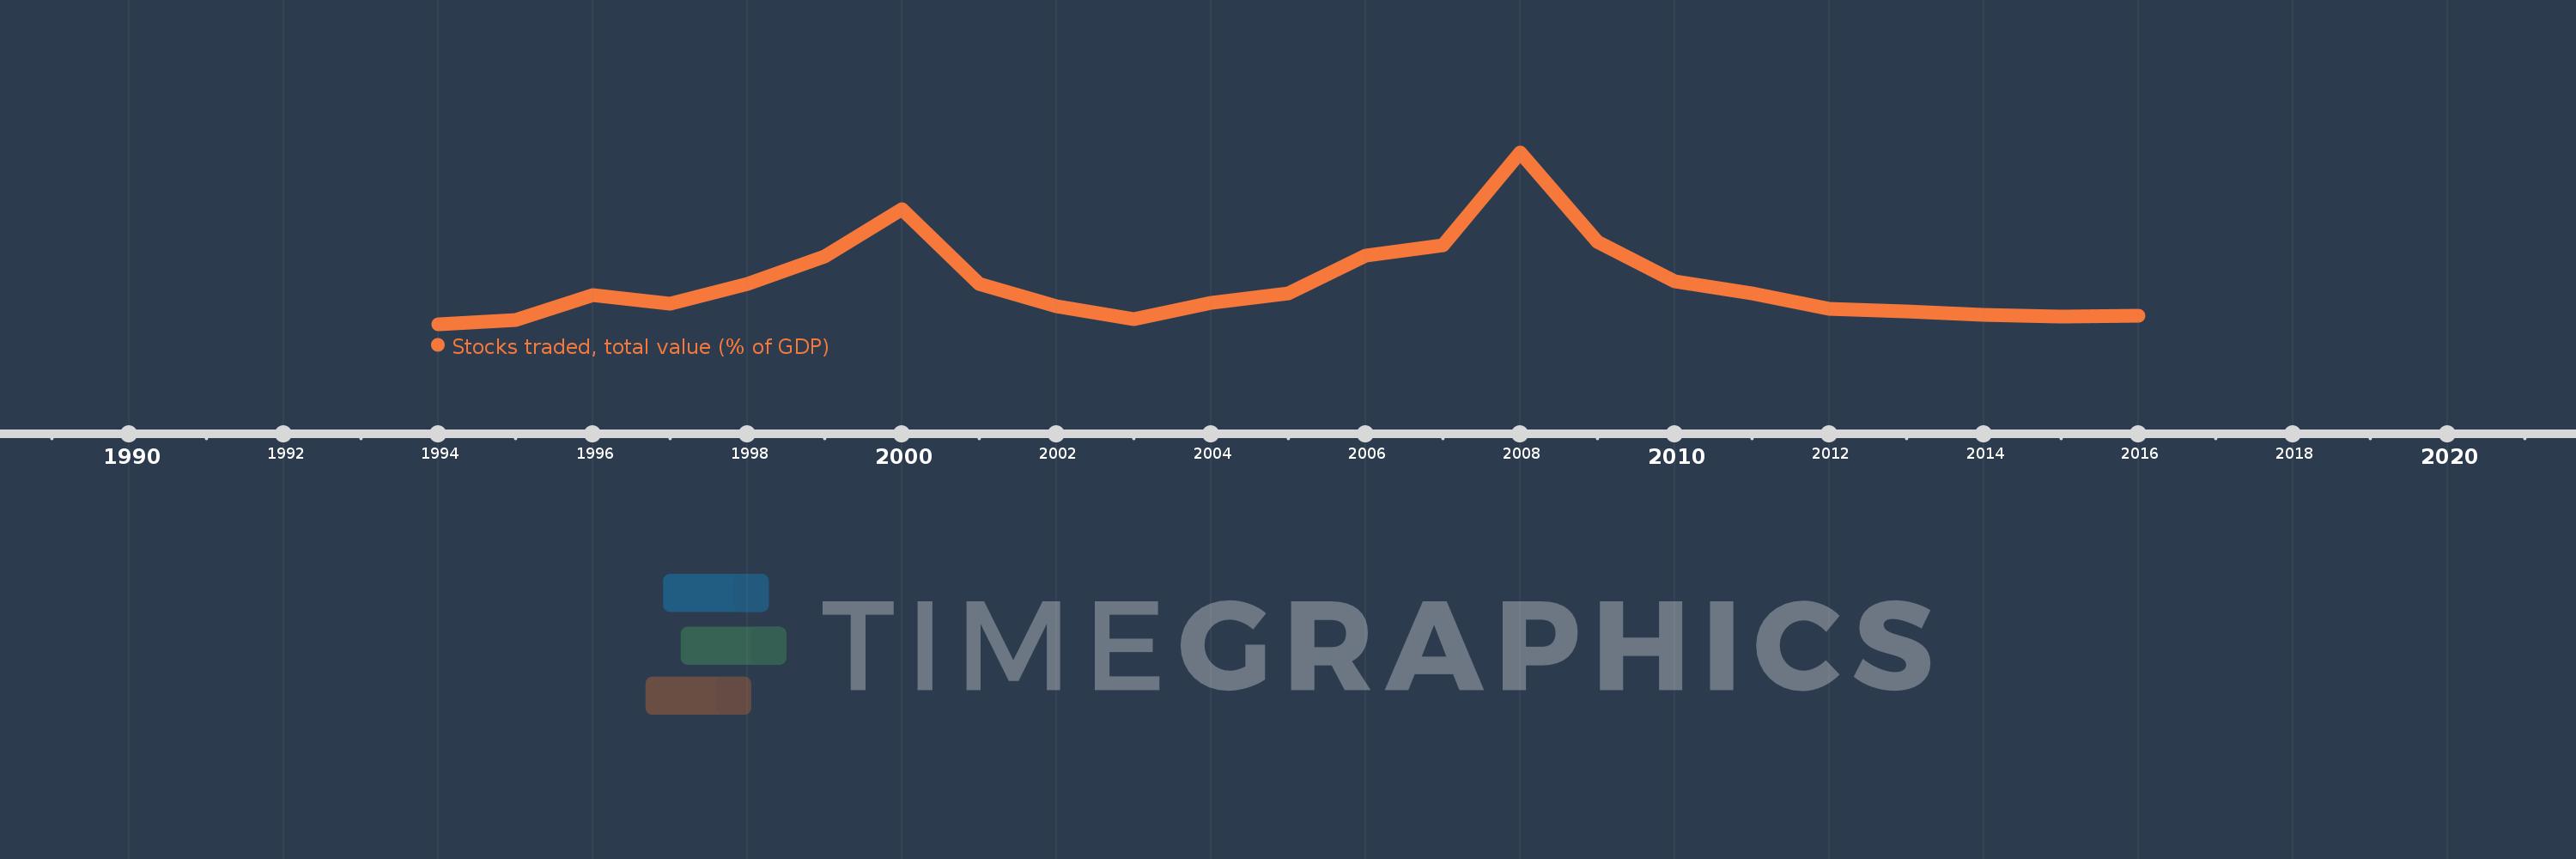
Nesta escala de tempo está apresentado um gráfico de 1994 ano até 2016 ano Morocco. Dados de 1993 ano ausente. O número de observações reais por data: 23.

Fonte (nome):

Indicadores de desenvolvimento mundial

Fonte (organização):

World Federation of Exchanges database.

Categorias:

Financial Sector

Foi atualizado:

23 abr 2017 ano

Indicadores de alterações dos valores ao longo dos anos

Em média:
8.022
Mínimo:
1.542
1 jan 1994 ano
Máximo:
29.316
1 jan 2008 ano
Na data de observação
Valor
Mudança absoluta
A alteração em relação ao valor anterior
1 jan 1994 ano
1.542
+1.542
0.0%
1 jan 1995 ano
2.283
+0.741
48.07%
1 jan 1996 ano
6.267
+3.985
174.57%
1 jan 1997 ano
4.797
-1.47
-23.46%
1 jan 1998 ano
8.09
+3.293
68.63%
1 jan 1999 ano
12.455
+4.365
53.96%
1 jan 2000 ano
20.093
+7.638
61.32%
1 jan 2001 ano
8.122
-11.971
-59.58%
1 jan 2002 ano
4.394
-3.728
-45.9%
1 jan 2003 ano
2.365
-2.029
-46.17%
1 jan 2004 ano
4.953
+2.588
109.41%
1 jan 2005 ano
6.589
+1.636
33.04%
1 jan 2006 ano
12.657
+6.068
92.09%
1 jan 2007 ano
14.364
+1.707
13.49%
1 jan 2008 ano
29.316
+14.953
104.1%
1 jan 2009 ano
14.882
-14.434
-49.24%
1 jan 2010 ano
8.518
-6.364
-42.76%
1 jan 2011 ano
6.542
-1.976
-23.2%
1 jan 2012 ano
4.037
-2.505
-38.29%
1 jan 2013 ano
3.555
-0.483
-11.95%
1 jan 2014 ano
3.03
-0.525
-14.76%
1 jan 2015 ano
2.767
-0.263
-8.69%
1 jan 2016 ano
2.902
+0.135
4.89%

Classificação de países por estatísticas atuais por anos