33
/pt/
AIzaSyAYiBZKx7MnpbEhh9jyipgxe19OcubqV5w
August 1, 2025
226423
Portugal
PRT
true
2
1
Stocks traded, total value (% of GDP)
2015,2014,2013,2012,2011,2010,2009,2008,2007,2006,2005,2004,2003,2002,2001,2000,1999,1998,1997,1996,1995,1994
Download
Biblioteca de estatísticas globais →Portugal →

Stocks traded, total value (% of GDP)

Estas estatísticas em outros países:

Arab WorldArgentinaArmeniaAustraliaAustriaBahrainBangladeshBarbadosBelgiumBermudaBoliviaBotswanaBrazilBulgariaCanadaCayman IslandsCentral Europe and the BalticsChannel IslandsChileChinaColombiaCosta RicaCote d'IvoireCroatiaCyprusCzech RepublicDenmarkEarly-demographic dividendEast Asia & PacificEast Asia & Pacific (excluding high income)East Asia & Pacific (IDA & IBRD countries)EcuadorEgypt, Arab Rep.El SalvadorEstoniaEuro areaEurope & Central AsiaEurope & Central Asia (excluding high income)Europe & Central Asia (IDA & IBRD countries)European UnionFijiFinlandFranceGeorgiaGermanyGhanaGreeceGuyanaHigh incomeHong Kong SAR, ChinaHungaryIBRD onlyIcelandIDA & IBRD totalIDA blendIDA totalIndiaIndonesiaIran, Islamic Rep.IrelandIsraelItalyJamaicaJapanJordanKazakhstanKenyaKorea, Rep.KuwaitKyrgyz RepublicLate-demographic dividendLatin America & Caribbean Latin America & Caribbean (excluding high income)Latin America & the Caribbean (IDA & IBRD countries)LatviaLebanonLithuaniaLow & middle incomeLower middle incomeLuxembourgMacedonia, FYRMalawiMalaysiaMaltaMauritiusMexicoMiddle East & North AfricaMiddle East & North Africa (excluding high income)Middle East & North Africa (IDA & IBRD countries)Middle incomeMoldovaMongoliaMontenegroMoroccoNamibiaNetherlandsNew ZealandNigeriaNorth AmericaNorwayOECD membersOmanOther small statesPakistanPanamaPapua New GuineaParaguayPeruPhilippinesPolandPortugalPost-demographic dividendQatarRomaniaRussian FederationSaudi ArabiaSerbiaSeychellesSingaporeSlovak RepublicSloveniaSouth AfricaSouth AsiaSouth Asia (IDA & IBRD)SpainSri LankaSt. Kitts and NevisSub-Saharan Africa Sub-Saharan Africa (excluding high income)Sub-Saharan Africa (IDA & IBRD countries)SwazilandSwedenSwitzerlandTanzaniaThailandTrinidad and TobagoTunisiaTurkeyUgandaUkraineUnited Arab EmiratesUnited KingdomUnited StatesUpper middle incomeUruguayUzbekistanVenezuela, RBVietnamWest Bank and GazaWorldZambiaZimbabwe

Linha do tempo:

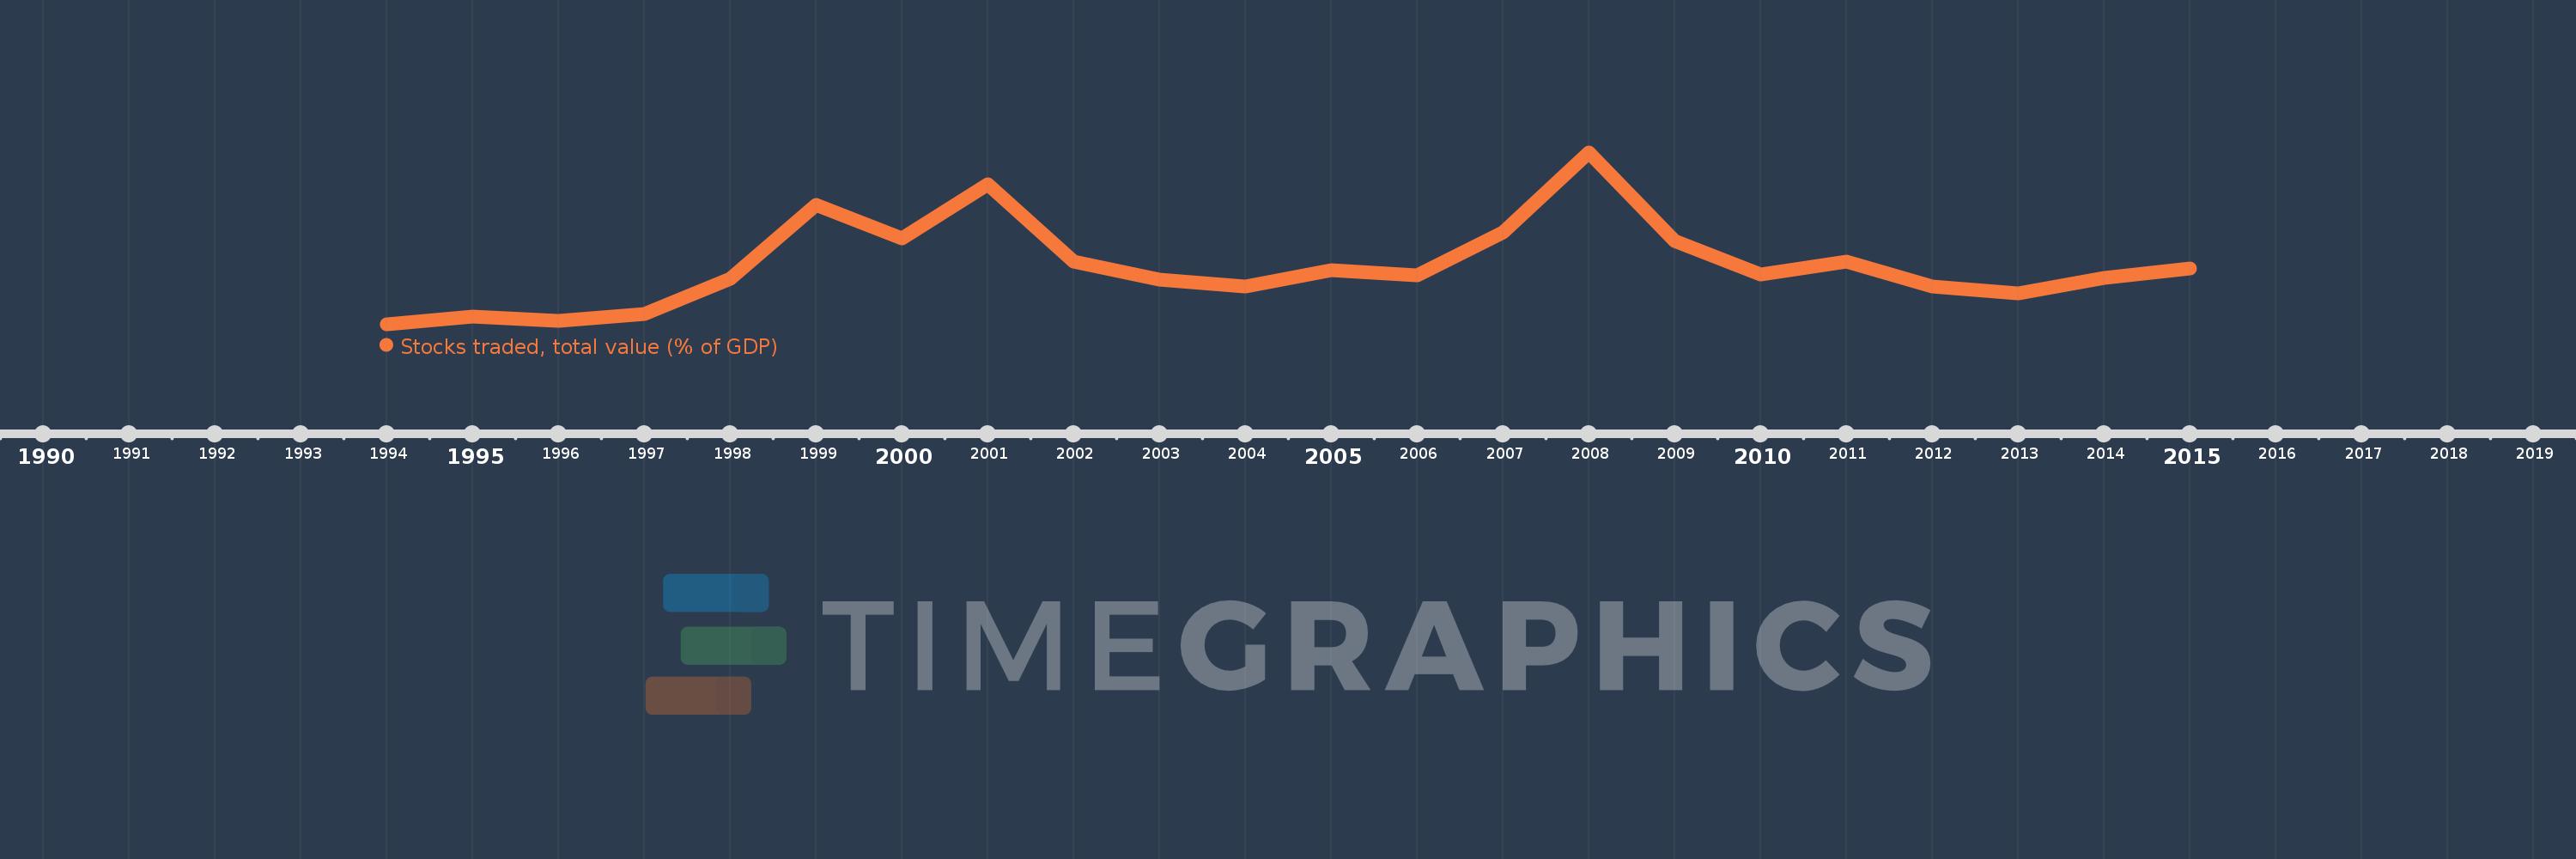
Nesta escala de tempo está apresentado um gráfico de 1994 ano até 2015 ano Portugal. Dados de 1993 ano ausente. O número de observações reais por data: 22.

Fonte (nome):

Indicadores de desenvolvimento mundial

Fonte (organização):

World Federation of Exchanges database.

Categorias:

Financial Sector

Foi atualizado:

23 abr 2017 ano

Indicadores de alterações dos valores ao longo dos anos

Em média:
21.173
Mínimo:
2.522
1 jan 1994 ano
Máximo:
57.21
1 jan 2008 ano
Na data de observação
Valor
Mudança absoluta
A alteração em relação ao valor anterior
1 jan 1994 ano
2.522
+2.522
0.0%
1 jan 1995 ano
4.994
+2.471
97.97%
1 jan 1996 ano
3.566
-1.428
-28.59%
1 jan 1997 ano
5.773
+2.207
61.89%
1 jan 1998 ano
16.99
+11.218
194.33%
1 jan 1999 ano
40.509
+23.518
138.42%
1 jan 2000 ano
29.94
-10.569
-26.09%
1 jan 2001 ano
46.963
+17.023
56.86%
1 jan 2002 ano
22.449
-24.514
-52.2%
1 jan 2003 ano
16.807
-5.642
-25.13%
1 jan 2004 ano
14.489
-2.318
-13.79%
1 jan 2005 ano
19.619
+5.13
35.41%
1 jan 2006 ano
18.107
-1.512
-7.71%
1 jan 2007 ano
31.662
+13.555
74.86%
1 jan 2008 ano
57.21
+25.548
80.69%
1 jan 2009 ano
28.972
-28.239
-49.36%
1 jan 2010 ano
18.367
-10.604
-36.6%
1 jan 2011 ano
22.513
+4.145
22.57%
1 jan 2012 ano
14.556
-7.956
-35.34%
1 jan 2013 ano
12.218
-2.338
-16.06%
1 jan 2014 ano
17.239
+5.021
41.09%
1 jan 2015 ano
20.34
+3.1
17.99%

Classificação de países por estatísticas atuais por anos