30
/pt/
AIzaSyAYiBZKx7MnpbEhh9jyipgxe19OcubqV5w
April 1, 2024
51512
Middle income
MIC
false
2
1
Stocks traded, total value (% of GDP)
2016,2015,2014,2013,2012,2011,2010,2009,2008,2007,2006,2005,2004,2003,2002,2001,2000,1999,1998,1997,1996,1995,1994
Download
Biblioteca de estatísticas globais →Middle income →

Stocks traded, total value (% of GDP)

Estas estatísticas em outros países:

Arab WorldArgentinaArmeniaAustraliaAustriaBahrainBangladeshBarbadosBelgiumBermudaBoliviaBotswanaBrazilBulgariaCanadaCayman IslandsCentral Europe and the BalticsChannel IslandsChileChinaColombiaCosta RicaCote d'IvoireCroatiaCyprusCzech RepublicDenmarkEarly-demographic dividendEast Asia & PacificEast Asia & Pacific (excluding high income)East Asia & Pacific (IDA & IBRD countries)EcuadorEgypt, Arab Rep.El SalvadorEstoniaEuro areaEurope & Central AsiaEurope & Central Asia (excluding high income)Europe & Central Asia (IDA & IBRD countries)European UnionFijiFinlandFranceGeorgiaGermanyGhanaGreeceGuyanaHigh incomeHong Kong SAR, ChinaHungaryIBRD onlyIcelandIDA & IBRD totalIDA blendIDA totalIndiaIndonesiaIran, Islamic Rep.IrelandIsraelItalyJamaicaJapanJordanKazakhstanKenyaKorea, Rep.KuwaitKyrgyz RepublicLate-demographic dividendLatin America & Caribbean Latin America & Caribbean (excluding high income)Latin America & the Caribbean (IDA & IBRD countries)LatviaLebanonLithuaniaLow & middle incomeLower middle incomeLuxembourgMacedonia, FYRMalawiMalaysiaMaltaMauritiusMexicoMiddle East & North AfricaMiddle East & North Africa (excluding high income)Middle East & North Africa (IDA & IBRD countries)Middle incomeMoldovaMongoliaMontenegroMoroccoNamibiaNetherlandsNew ZealandNigeriaNorth AmericaNorwayOECD membersOmanOther small statesPakistanPanamaPapua New GuineaParaguayPeruPhilippinesPolandPortugalPost-demographic dividendQatarRomaniaRussian FederationSaudi ArabiaSerbiaSeychellesSingaporeSlovak RepublicSloveniaSouth AfricaSouth AsiaSouth Asia (IDA & IBRD)SpainSri LankaSt. Kitts and NevisSub-Saharan Africa Sub-Saharan Africa (excluding high income)Sub-Saharan Africa (IDA & IBRD countries)SwazilandSwedenSwitzerlandTanzaniaThailandTrinidad and TobagoTunisiaTurkeyUgandaUkraineUnited Arab EmiratesUnited KingdomUnited StatesUpper middle incomeUruguayUzbekistanVenezuela, RBVietnamWest Bank and GazaWorldZambiaZimbabwe

Linha do tempo:

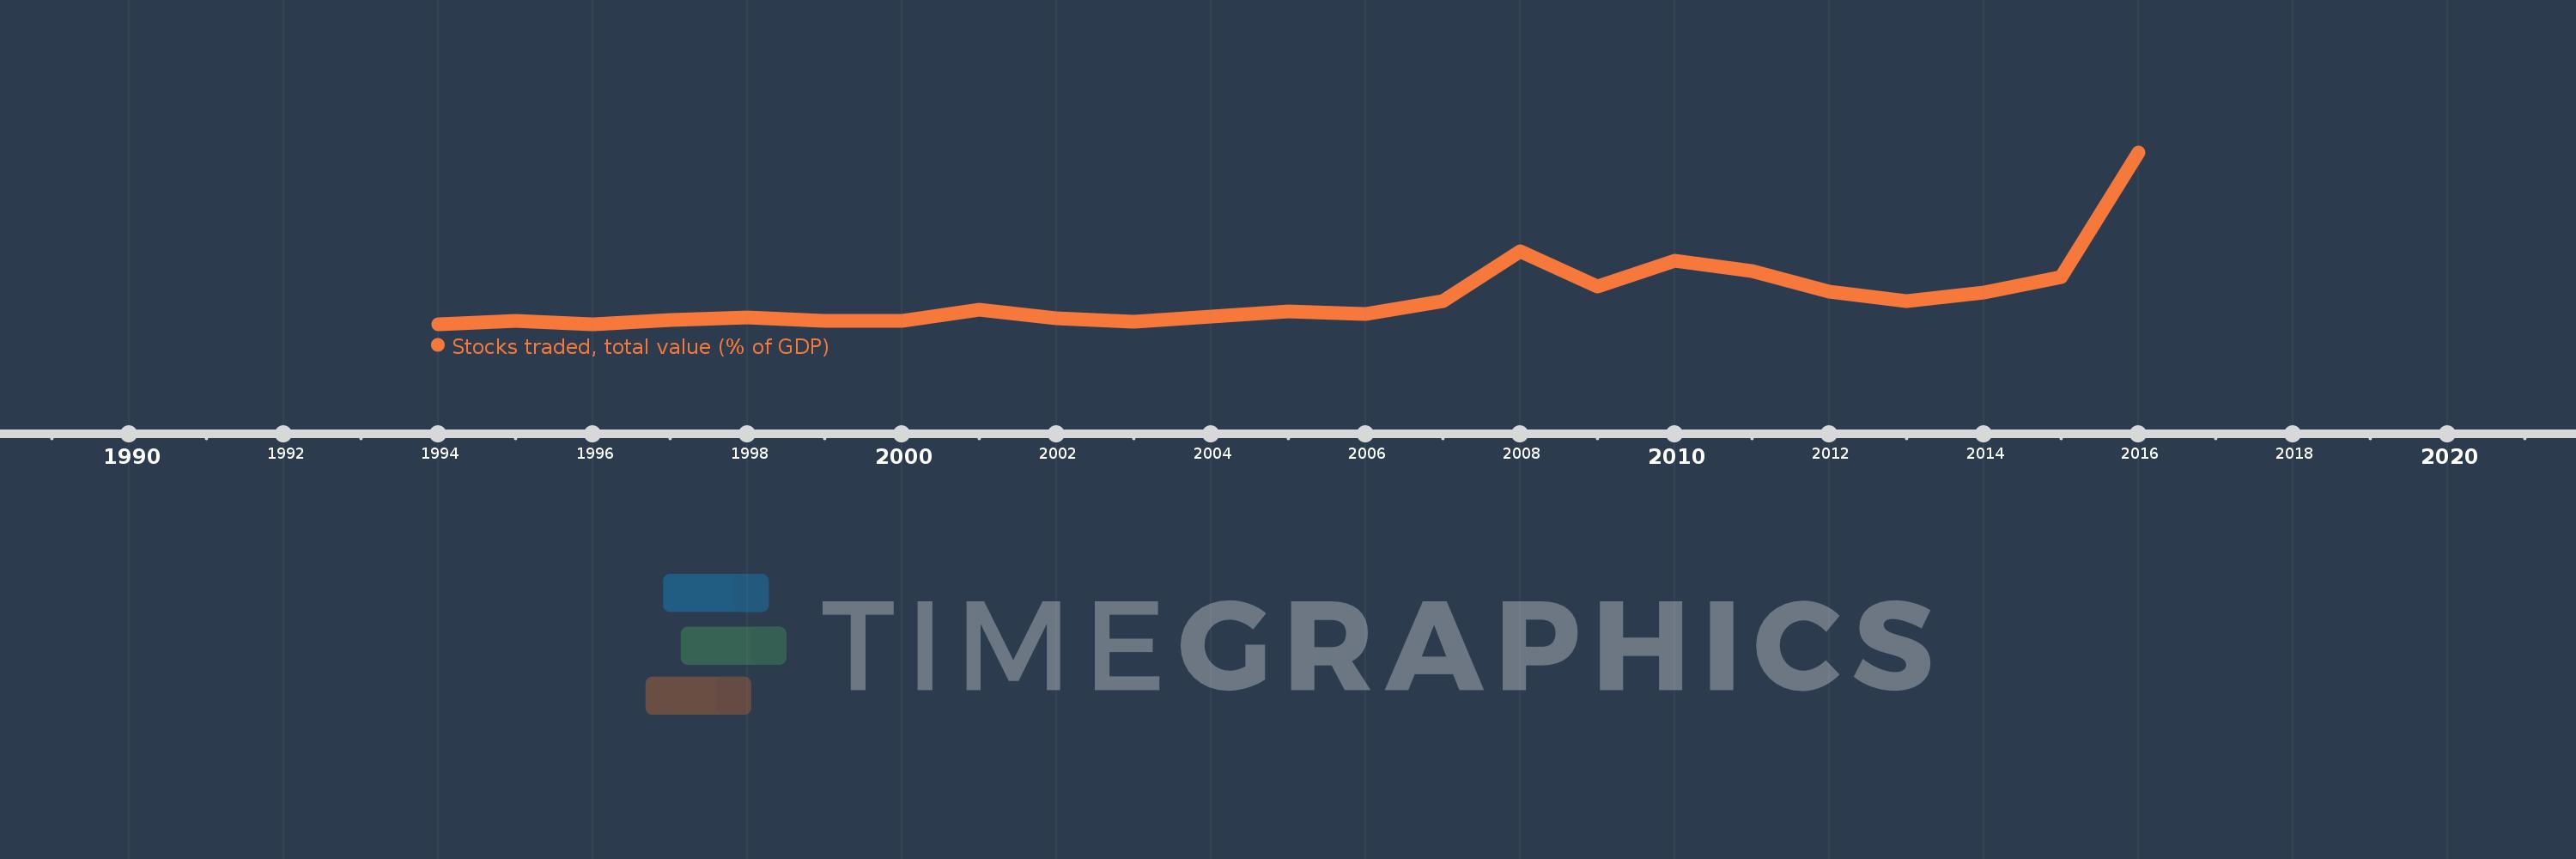
Nesta escala de tempo está apresentado um gráfico de 1994 ano até 2016 ano Middle income. Dados de 1993 ano ausente. O número de observações reais por data: 23.

Fonte (nome):

Indicadores de desenvolvimento mundial

Fonte (organização):

World Federation of Exchanges database.

Categorias:

Financial Sector

Foi atualizado:

23 abr 2017 ano

Indicadores de alterações dos valores ao longo dos anos

Em média:
39.366
Mínimo:
12.118
1 jan 1994 ano
Máximo:
182.447
1 jan 2016 ano
Na data de observação
Valor
Mudança absoluta
A alteração em relação ao valor anterior
1 jan 1994 ano
12.118
+12.118
0.0%
1 jan 1995 ano
15.305
+3.187
26.3%
1 jan 1996 ano
12.348
-2.958
-19.32%
1 jan 1997 ano
16.565
+4.217
34.15%
1 jan 1998 ano
18.951
+2.386
14.41%
1 jan 1999 ano
15.464
-3.487
-18.4%
1 jan 2000 ano
15.256
-0.208
-1.34%
1 jan 2001 ano
26.185
+10.929
71.63%
1 jan 2002 ano
17.892
-8.293
-31.67%
1 jan 2003 ano
14.75
-3.141
-17.56%
1 jan 2004 ano
19.652
+4.901
33.23%
1 jan 2005 ano
24.74
+5.088
25.89%
1 jan 2006 ano
22.354
-2.386
-9.64%
1 jan 2007 ano
35.216
+12.862
57.54%
1 jan 2008 ano
84.698
+49.482
140.51%
1 jan 2009 ano
49.798
-34.9
-41.21%
1 jan 2010 ano
74.944
+25.146
50.5%
1 jan 2011 ano
65.162
-9.782
-13.05%
1 jan 2012 ano
44.729
-20.433
-31.36%
1 jan 2013 ano
34.715
-10.014
-22.39%
1 jan 2014 ano
43.267
+8.552
24.64%
1 jan 2015 ano
58.869
+15.602
36.06%
1 jan 2016 ano
182.447
+123.578
209.92%

Classificação de países por estatísticas atuais por anos