33
/pt/
AIzaSyAYiBZKx7MnpbEhh9jyipgxe19OcubqV5w
August 1, 2025
113007
Costa Rica
CRI
true
2
1
Stocks traded, total value (% of GDP)
2014,2013,2012,2011,2010,2009,2008,2007,2006,2005,2004,2000,1999,1998,1997,1996,1995,1994
Download
Biblioteca de estatísticas globais →Costa Rica →

Stocks traded, total value (% of GDP)

Estas estatísticas em outros países:

Arab WorldArgentinaArmeniaAustraliaAustriaBahrainBangladeshBarbadosBelgiumBermudaBoliviaBotswanaBrazilBulgariaCanadaCayman IslandsCentral Europe and the BalticsChannel IslandsChileChinaColombiaCosta RicaCote d'IvoireCroatiaCyprusCzech RepublicDenmarkEarly-demographic dividendEast Asia & PacificEast Asia & Pacific (excluding high income)East Asia & Pacific (IDA & IBRD countries)EcuadorEgypt, Arab Rep.El SalvadorEstoniaEuro areaEurope & Central AsiaEurope & Central Asia (excluding high income)Europe & Central Asia (IDA & IBRD countries)European UnionFijiFinlandFranceGeorgiaGermanyGhanaGreeceGuyanaHigh incomeHong Kong SAR, ChinaHungaryIBRD onlyIcelandIDA & IBRD totalIDA blendIDA totalIndiaIndonesiaIran, Islamic Rep.IrelandIsraelItalyJamaicaJapanJordanKazakhstanKenyaKorea, Rep.KuwaitKyrgyz RepublicLate-demographic dividendLatin America & Caribbean Latin America & Caribbean (excluding high income)Latin America & the Caribbean (IDA & IBRD countries)LatviaLebanonLithuaniaLow & middle incomeLower middle incomeLuxembourgMacedonia, FYRMalawiMalaysiaMaltaMauritiusMexicoMiddle East & North AfricaMiddle East & North Africa (excluding high income)Middle East & North Africa (IDA & IBRD countries)Middle incomeMoldovaMongoliaMontenegroMoroccoNamibiaNetherlandsNew ZealandNigeriaNorth AmericaNorwayOECD membersOmanOther small statesPakistanPanamaPapua New GuineaParaguayPeruPhilippinesPolandPortugalPost-demographic dividendQatarRomaniaRussian FederationSaudi ArabiaSerbiaSeychellesSingaporeSlovak RepublicSloveniaSouth AfricaSouth AsiaSouth Asia (IDA & IBRD)SpainSri LankaSt. Kitts and NevisSub-Saharan Africa Sub-Saharan Africa (excluding high income)Sub-Saharan Africa (IDA & IBRD countries)SwazilandSwedenSwitzerlandTanzaniaThailandTrinidad and TobagoTunisiaTurkeyUgandaUkraineUnited Arab EmiratesUnited KingdomUnited StatesUpper middle incomeUruguayUzbekistanVenezuela, RBVietnamWest Bank and GazaWorldZambiaZimbabwe

Linha do tempo:

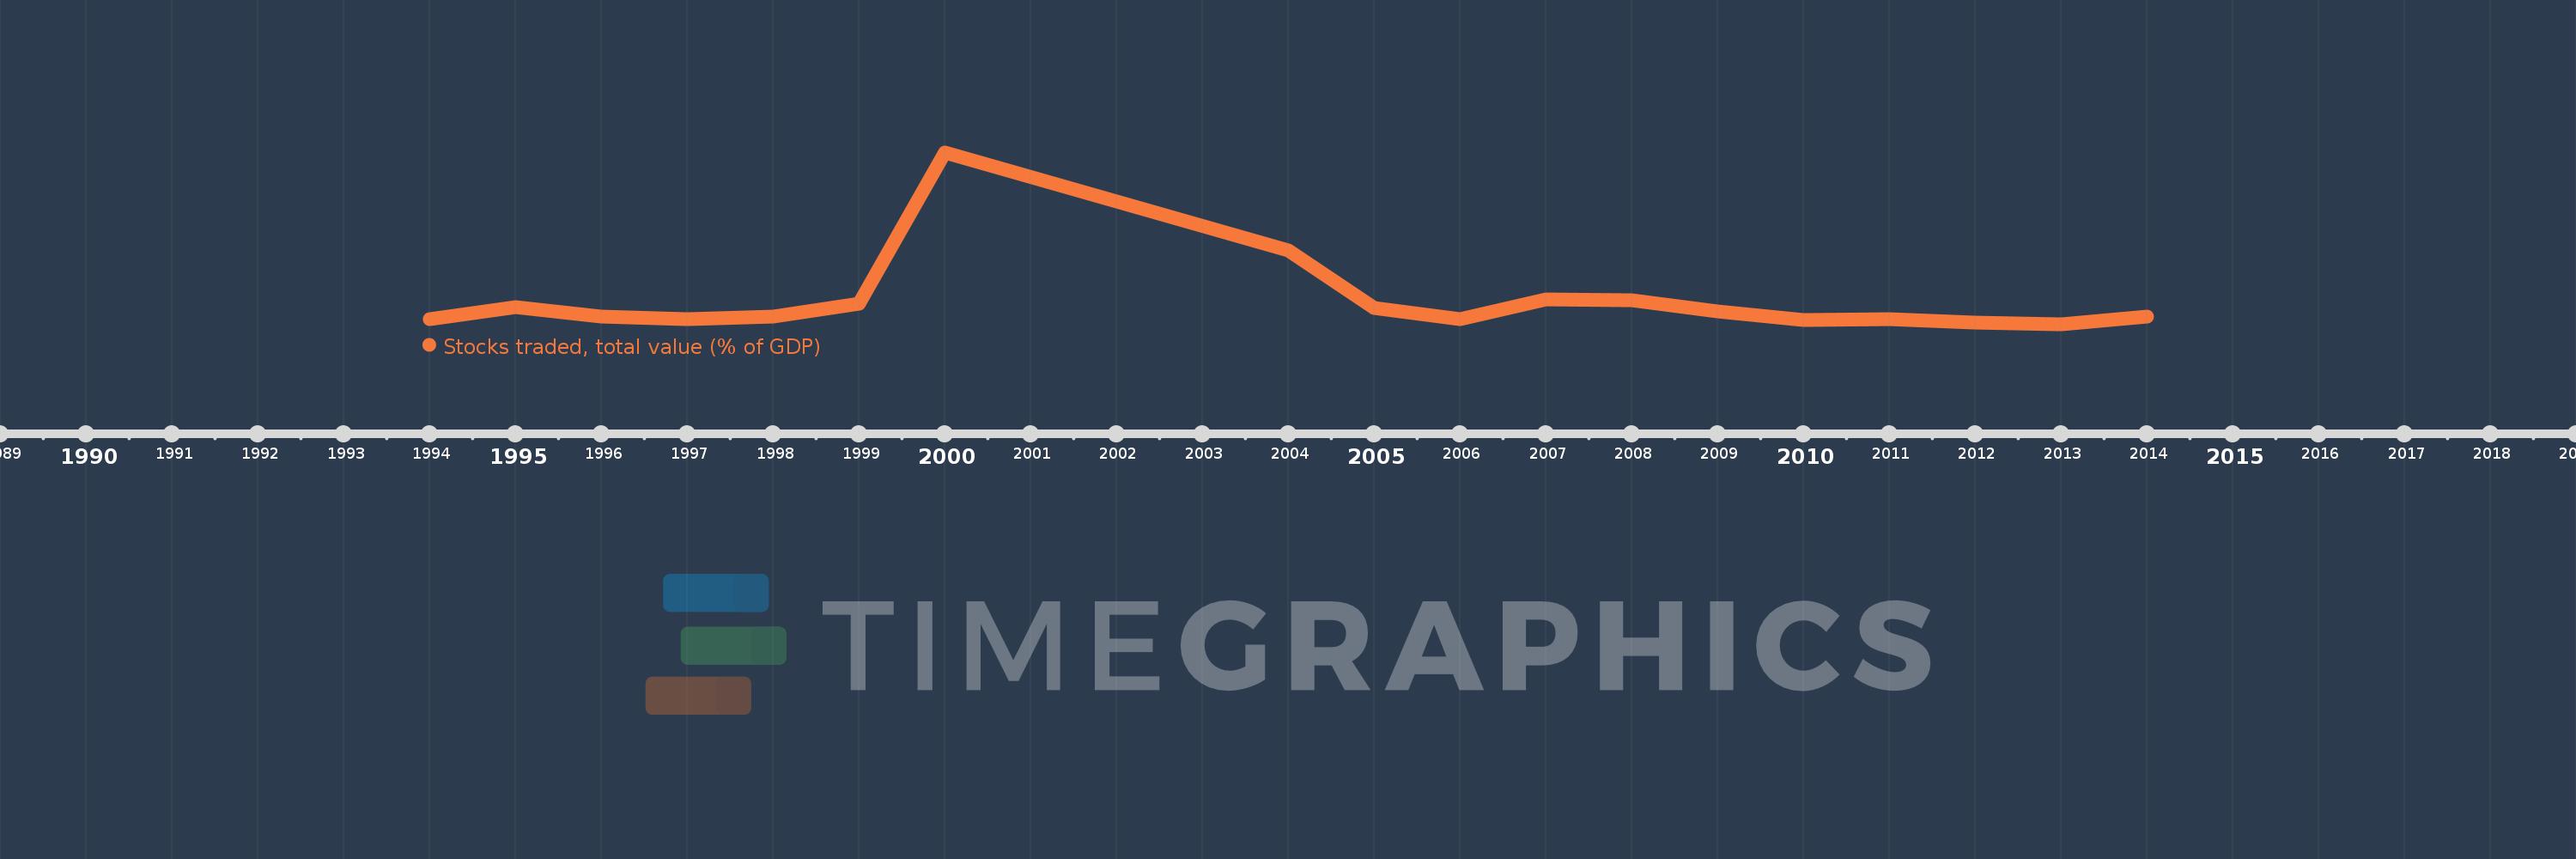
Nesta escala de tempo está apresentado um gráfico de 1994 ano até 2014 ano Costa Rica. Dados de 1993 ano ausente. O número de observações reais por data: 18.

Fonte (nome):

Indicadores de desenvolvimento mundial

Fonte (organização):

World Federation of Exchanges database.

Categorias:

Financial Sector

Foi atualizado:

23 abr 2017 ano

Indicadores de alterações dos valores ao longo dos anos

Em média:
0.257
Mínimo:
0.072
1 jan 2013 ano
Máximo:
1.467
1 jan 2000 ano
Na data de observação
Valor
Mudança absoluta
A alteração em relação ao valor anterior
1 jan 1994 ano
0.115
+0.115
0.0%
1 jan 1995 ano
0.208
+0.093
80.34%
1 jan 1996 ano
0.137
-0.071
-34.27%
1 jan 1997 ano
0.116
-0.02
-14.94%
1 jan 1998 ano
0.137
+0.021
18.18%
1 jan 1999 ano
0.238
+0.1
72.92%
1 jan 2000 ano
1.467
+1.23
517.54%
1 jan 2004 ano
0.668
-0.799
-54.47%
1 jan 2005 ano
0.203
-0.465
-69.65%
1 jan 2006 ano
0.11
-0.093
-45.88%
1 jan 2007 ano
0.274
+0.164
149.25%
1 jan 2008 ano
0.268
-0.006
-2.02%
1 jan 2009 ano
0.178
-0.09
-33.64%
1 jan 2010 ano
0.103
-0.075
-42.36%
1 jan 2011 ano
0.111
+0.008
8.2%
1 jan 2012 ano
0.087
-0.024
-21.46%
1 jan 2013 ano
0.072
-0.015
-17.04%
1 jan 2014 ano
0.133
+0.061
84.18%

Classificação de países por estatísticas atuais por anos