33
/pt/
AIzaSyAYiBZKx7MnpbEhh9jyipgxe19OcubqV5w
August 1, 2025
222677
Peru
PER
true
2
1
Persistence to grade 5, female (% of cohort)
2014,2012,2011,2010,2009,2008,2007,2006,2005,2004,2002,2001,2000,1999,1996,1994,1982,1981,1980,1978,1971
Download
Biblioteca de estatísticas globais →Peru →

Persistence to grade 5, female (% of cohort)

Estas estatísticas em outros países:

AfghanistanAlbaniaAlgeriaAndorraAngolaAntigua and BarbudaArab WorldArgentinaArubaBahamas, TheBahrainBangladeshBarbadosBelgiumBelizeBeninBermudaBhutanBoliviaBosnia and HerzegovinaBotswanaBrunei DarussalamBurkina FasoBurundiCabo VerdeCambodiaCameroonCanadaCaribbean small statesCayman IslandsCentral African RepublicChadChileChinaColombiaComorosCongo, Dem. Rep.Congo, Rep.Costa RicaCote d'IvoireCubaCyprusCzech RepublicDenmarkDjiboutiDominicaDominican RepublicEarly-demographic dividendEast Asia & PacificEast Asia & Pacific (excluding high income)East Asia & Pacific (IDA & IBRD countries)EcuadorEgypt, Arab Rep.El SalvadorEquatorial GuineaEritreaEstoniaEthiopiaFijiFinlandFranceGabonGambia, TheGeorgiaGhanaGreeceGrenadaGuatemalaGuineaGuinea-BissauGuyanaHaitiHeavily indebted poor countries (HIPC)HondurasHong Kong SAR, ChinaHungaryIcelandIDA blendIDA onlyIDA totalIndiaIndonesiaIran, Islamic Rep.IraqIrelandIsraelItalyJamaicaJapanJordanKenyaKiribatiKorea, Rep.KuwaitLao PDRLate-demographic dividendLatviaLeast developed countries: UN classificationLebanonLesothoLiberiaLibyaLiechtensteinLow incomeLower middle incomeLuxembourgMacao SAR, ChinaMadagascarMalawiMalaysiaMaldivesMaliMaltaMarshall IslandsMauritaniaMauritiusMexicoMiddle East & North AfricaMiddle East & North Africa (excluding high income)Middle East & North Africa (IDA & IBRD countries)MontenegroMoroccoMozambiqueMyanmarNamibiaNepalNetherlandsNicaraguaNigerNigeriaNorwayOmanOther small statesPacific island small statesPakistanPanamaPapua New GuineaParaguayPeruPhilippinesPolandPortugalPre-demographic dividendQatarRwandaSamoaSan MarinoSao Tome and PrincipeSaudi ArabiaSenegalSeychellesSierra LeoneSingaporeSloveniaSolomon IslandsSouth AfricaSouth AsiaSouth Asia (IDA & IBRD)SpainSri LankaSt. Kitts and NevisSt. LuciaSt. Vincent and the GrenadinesSub-Saharan Africa Sub-Saharan Africa (excluding high income)Sub-Saharan Africa (IDA & IBRD countries)SudanSurinameSwazilandSwedenSwitzerlandSyrian Arab RepublicTanzaniaThailandTimor-LesteTogoTongaTrinidad and TobagoTunisiaTurkeyUgandaUnited Arab EmiratesUpper middle incomeUruguayVanuatuVenezuela, RBVietnamYemen, Rep.ZambiaZimbabwe

Linha do tempo:

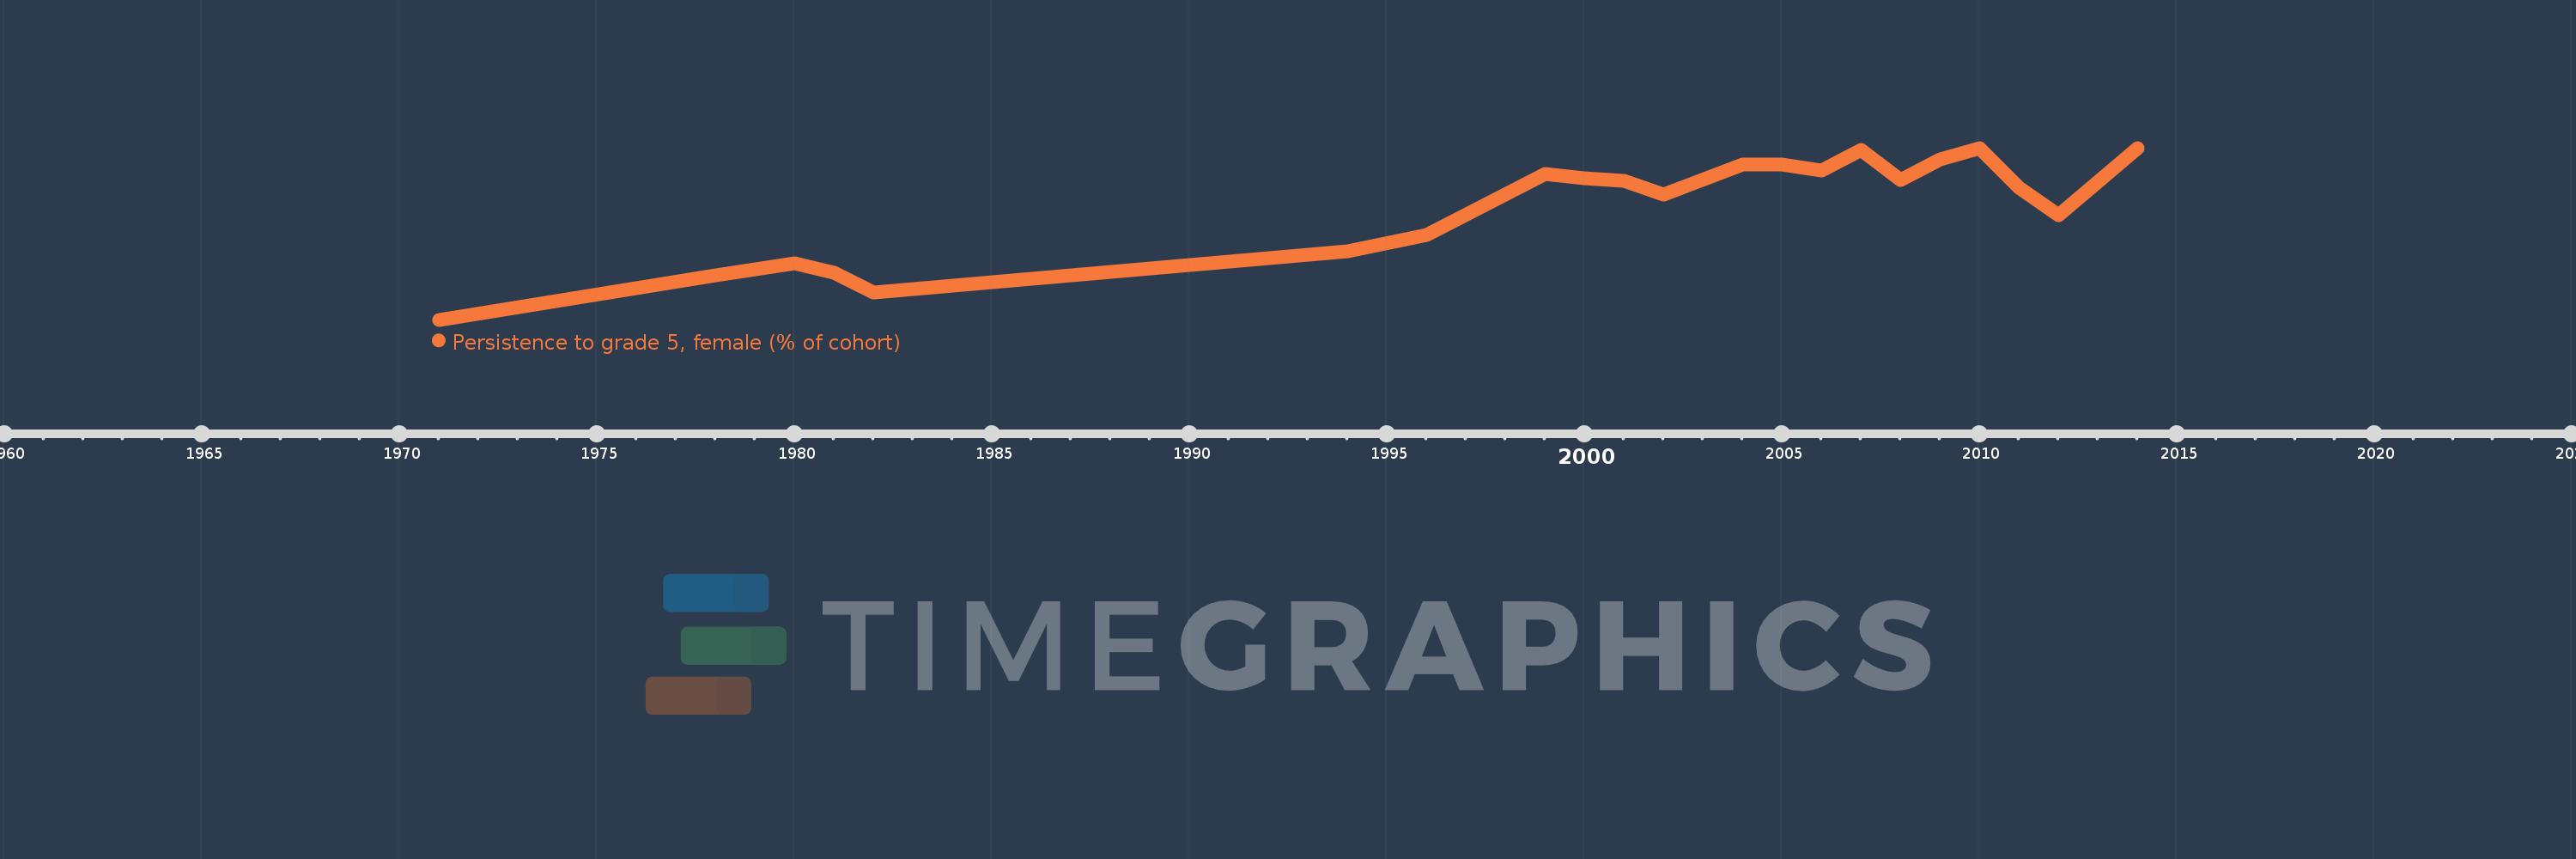
Nesta escala de tempo está apresentado um gráfico de 1971 ano até 2014 ano Peru. Dados de 1970 ano ausente. O número de observações reais por data: 21.

Fonte (nome):

Indicadores de desenvolvimento mundial

Fonte (organização):

United Nations Educational, Scientific, and Cultural Organization (UNESCO) Institute for Statistics.

Categorias:

Education, Gender

Foi atualizado:

23 abr 2017 ano

Indicadores de alterações dos valores ao longo dos anos

Em média:
80.077
Mínimo:
53.18
1 jan 1971 ano
Máximo:
93.778
1 jan 2014 ano
Na data de observação
Valor
Mudança absoluta
A alteração em relação ao valor anterior
1 jan 1971 ano
53.18
+53.18
0.0%
1 jan 1978 ano
63.662
+10.482
19.71%
1 jan 1980 ano
66.545
+2.883
4.53%
1 jan 1981 ano
64.223
-2.322
-3.49%
1 jan 1982 ano
59.694
-4.53
-7.05%
1 jan 1994 ano
69.441
+9.748
16.33%
1 jan 1996 ano
73.295
+3.854
5.55%
1 jan 1999 ano
87.584
+14.288
19.49%
1 jan 2000 ano
86.66
-0.924
-1.05%
1 jan 2001 ano
86.08
-0.58
-0.67%
1 jan 2002 ano
82.733
-3.347
-3.89%
1 jan 2004 ano
89.775
+7.042
8.51%
1 jan 2005 ano
89.895
+0.12
0.13%
1 jan 2006 ano
88.54
-1.355
-1.51%
1 jan 2007 ano
93.29
+4.75
5.36%
1 jan 2008 ano
86.183
-7.107
-7.62%
1 jan 2009 ano
91.081
+4.899
5.68%
1 jan 2010 ano
93.722
+2.641
2.9%
1 jan 2011 ano
84.439
-9.283
-9.91%
1 jan 2012 ano
77.817
-6.622
-7.84%
1 jan 2014 ano
93.778
+15.961
20.51%

Classificação de países por estatísticas atuais por anos