33
/pt/
AIzaSyAYiBZKx7MnpbEhh9jyipgxe19OcubqV5w
August 1, 2025
208310
Netherlands
NLD
true
2
1
Persistence to grade 5, female (% of cohort)
2010,2009,2008,2007,2006,2005,2004,2003,2002,2001,2000,1978,1977,1976,1975,1974,1973,1972
Download
Biblioteca de estatísticas globais →Netherlands →

Persistence to grade 5, female (% of cohort)

Estas estatísticas em outros países:

AfghanistanAlbaniaAlgeriaAndorraAngolaAntigua and BarbudaArab WorldArgentinaArubaBahamas, TheBahrainBangladeshBarbadosBelgiumBelizeBeninBermudaBhutanBoliviaBosnia and HerzegovinaBotswanaBrunei DarussalamBurkina FasoBurundiCabo VerdeCambodiaCameroonCanadaCaribbean small statesCayman IslandsCentral African RepublicChadChileChinaColombiaComorosCongo, Dem. Rep.Congo, Rep.Costa RicaCote d'IvoireCubaCyprusCzech RepublicDenmarkDjiboutiDominicaDominican RepublicEarly-demographic dividendEast Asia & PacificEast Asia & Pacific (excluding high income)East Asia & Pacific (IDA & IBRD countries)EcuadorEgypt, Arab Rep.El SalvadorEquatorial GuineaEritreaEstoniaEthiopiaFijiFinlandFranceGabonGambia, TheGeorgiaGhanaGreeceGrenadaGuatemalaGuineaGuinea-BissauGuyanaHaitiHeavily indebted poor countries (HIPC)HondurasHong Kong SAR, ChinaHungaryIcelandIDA blendIDA onlyIDA totalIndiaIndonesiaIran, Islamic Rep.IraqIrelandIsraelItalyJamaicaJapanJordanKenyaKiribatiKorea, Rep.KuwaitLao PDRLate-demographic dividendLatviaLeast developed countries: UN classificationLebanonLesothoLiberiaLibyaLiechtensteinLow incomeLower middle incomeLuxembourgMacao SAR, ChinaMadagascarMalawiMalaysiaMaldivesMaliMaltaMarshall IslandsMauritaniaMauritiusMexicoMiddle East & North AfricaMiddle East & North Africa (excluding high income)Middle East & North Africa (IDA & IBRD countries)MontenegroMoroccoMozambiqueMyanmarNamibiaNepalNetherlandsNicaraguaNigerNigeriaNorwayOmanOther small statesPacific island small statesPakistanPanamaPapua New GuineaParaguayPeruPhilippinesPolandPortugalPre-demographic dividendQatarRwandaSamoaSan MarinoSao Tome and PrincipeSaudi ArabiaSenegalSeychellesSierra LeoneSingaporeSloveniaSolomon IslandsSouth AfricaSouth AsiaSouth Asia (IDA & IBRD)SpainSri LankaSt. Kitts and NevisSt. LuciaSt. Vincent and the GrenadinesSub-Saharan Africa Sub-Saharan Africa (excluding high income)Sub-Saharan Africa (IDA & IBRD countries)SudanSurinameSwazilandSwedenSwitzerlandSyrian Arab RepublicTanzaniaThailandTimor-LesteTogoTongaTrinidad and TobagoTunisiaTurkeyUgandaUnited Arab EmiratesUpper middle incomeUruguayVanuatuVenezuela, RBVietnamYemen, Rep.ZambiaZimbabwe

Linha do tempo:

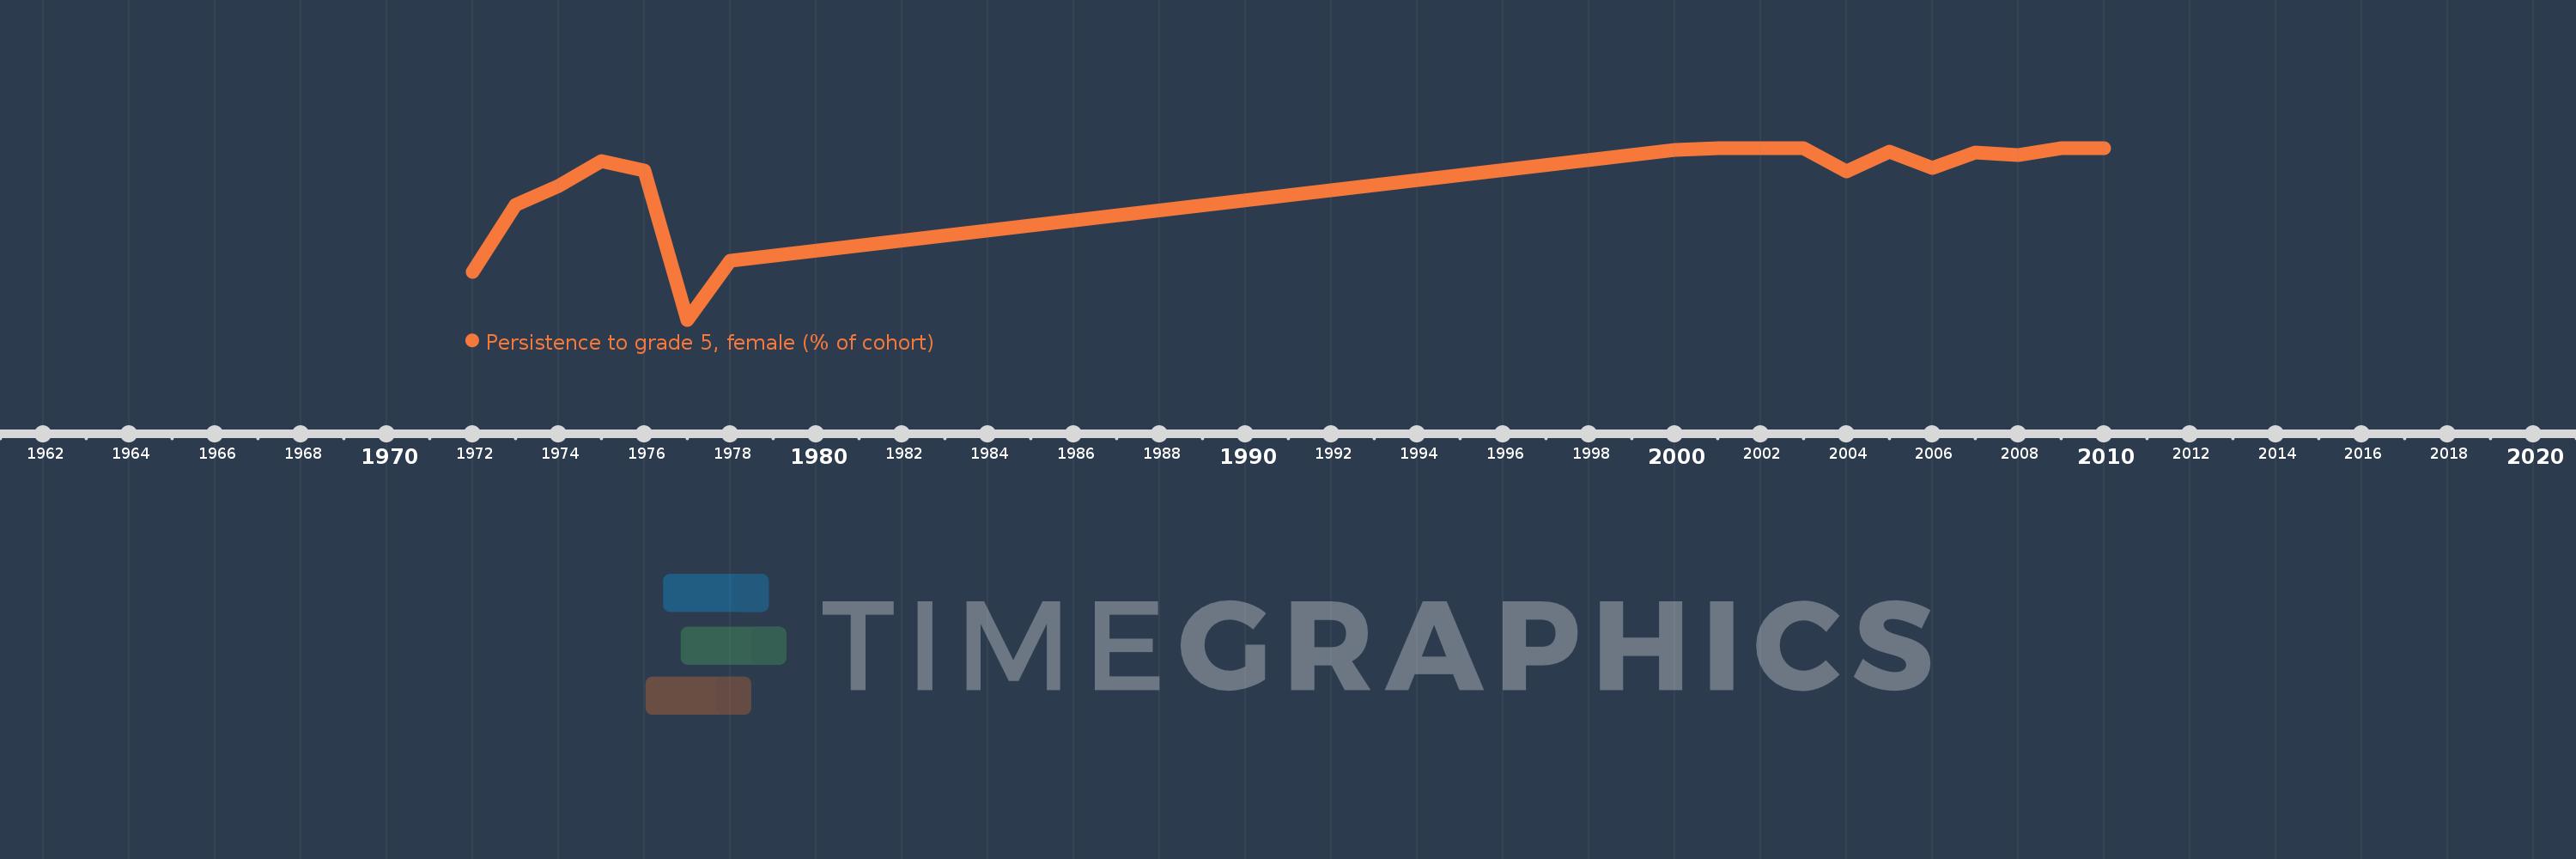
Nesta escala de tempo está apresentado um gráfico de 1972 ano até 2010 ano Netherlands. Dados de 1971 ano ausente. O número de observações reais por data: 18.

Fonte (nome):

Indicadores de desenvolvimento mundial

Fonte (organização):

United Nations Educational, Scientific, and Cultural Organization (UNESCO) Institute for Statistics.

Categorias:

Education, Gender

Foi atualizado:

23 abr 2017 ano

Indicadores de alterações dos valores ao longo dos anos

Em média:
98.814
Mínimo:
93.902
1 jan 1977 ano
Máximo:
100.0
1 jan 2002 ano
Na data de observação
Valor
Mudança absoluta
A alteração em relação ao valor anterior
1 jan 1972 ano
95.606
+95.606
0.0%
1 jan 1973 ano
97.975
+2.369
2.48%
1 jan 1974 ano
98.655
+0.68
0.69%
1 jan 1975 ano
99.532
+0.877
0.89%
1 jan 1976 ano
99.184
-0.347
-0.35%
1 jan 1977 ano
93.902
-5.282
-5.33%
1 jan 1978 ano
95.997
+2.095
2.23%
1 jan 2000 ano
99.916
+3.919
4.08%
1 jan 2001 ano
99.981
+0.065
0.06%
1 jan 2002 ano
100.0
+0.019
0.02%
1 jan 2003 ano
99.999
-0.001
0.0%
1 jan 2004 ano
99.16
-0.839
-0.84%
1 jan 2005 ano
99.868
+0.708
0.71%
1 jan 2006 ano
99.279
-0.589
-0.59%
1 jan 2007 ano
99.844
+0.565
0.57%
1 jan 2008 ano
99.757
-0.087
-0.09%
1 jan 2009 ano
100.0
+0.243
0.24%
1 jan 2010 ano
100.0
0.0
0.0%

Classificação de países por estatísticas atuais por anos