29
/pt/
pt
AIzaSyAYiBZKx7MnpbEhh9jyipgxe19OcubqV5w
April 1, 2024
104037
Chad
TCD
true
2
1
Persistence to grade 5, female (% of cohort)
2013,2012,2011,2010,2006,2005,2003,2002,2001,2000,1999,1998,1997,1996,1995,1992,1991,1990,1989,1978,1977
Download
Biblioteca de estatísticas globais →Chad →

Persistence to grade 5, female (% of cohort)

Estas estatísticas em outros países:
AfghanistanAlbaniaAlgeriaAndorraAngolaAntigua and BarbudaArab WorldArgentinaArubaBahamas, TheBahrainBangladeshBarbadosBelgiumBelizeBeninBermudaBhutanBoliviaBosnia and HerzegovinaBotswanaBrunei DarussalamBurkina FasoBurundiCabo VerdeCambodiaCameroonCanadaCaribbean small statesCayman IslandsCentral African RepublicChadChileChinaColombiaComorosCongo, Dem. Rep.Congo, Rep.Costa RicaCote d'IvoireCubaCyprusCzech RepublicDenmarkDjiboutiDominicaDominican RepublicEarly-demographic dividendEast Asia & PacificEast Asia & Pacific (excluding high income)East Asia & Pacific (IDA & IBRD countries)EcuadorEgypt, Arab Rep.El SalvadorEquatorial GuineaEritreaEstoniaEthiopiaFijiFinlandFranceGabonGambia, TheGeorgiaGhanaGreeceGrenadaGuatemalaGuineaGuinea-BissauGuyanaHaitiHeavily indebted poor countries (HIPC)HondurasHong Kong SAR, ChinaHungaryIcelandIDA blendIDA onlyIDA totalIndiaIndonesiaIran, Islamic Rep.IraqIrelandIsraelItalyJamaicaJapanJordanKenyaKiribatiKorea, Rep.KuwaitLao PDRLate-demographic dividendLatviaLeast developed countries: UN classificationLebanonLesothoLiberiaLibyaLiechtensteinLow incomeLower middle incomeLuxembourgMacao SAR, ChinaMadagascarMalawiMalaysiaMaldivesMaliMaltaMarshall IslandsMauritaniaMauritiusMexicoMiddle East & North AfricaMiddle East & North Africa (excluding high income)Middle East & North Africa (IDA & IBRD countries)MontenegroMoroccoMozambiqueMyanmarNamibiaNepalNetherlandsNicaraguaNigerNigeriaNorwayOmanOther small statesPacific island small statesPakistanPanamaPapua New GuineaParaguayPeruPhilippinesPolandPortugalPre-demographic dividendQatarRwandaSamoaSan MarinoSao Tome and PrincipeSaudi ArabiaSenegalSeychellesSierra LeoneSingaporeSloveniaSolomon IslandsSouth AfricaSouth AsiaSouth Asia (IDA & IBRD)SpainSri LankaSt. Kitts and NevisSt. LuciaSt. Vincent and the GrenadinesSub-Saharan Africa Sub-Saharan Africa (excluding high income)Sub-Saharan Africa (IDA & IBRD countries)SudanSurinameSwazilandSwedenSwitzerlandSyrian Arab RepublicTanzaniaThailandTimor-LesteTogoTongaTrinidad and TobagoTunisiaTurkeyUgandaUnited Arab EmiratesUpper middle incomeUruguayVanuatuVenezuela, RBVietnamYemen, Rep.ZambiaZimbabwe
Linha do tempo:
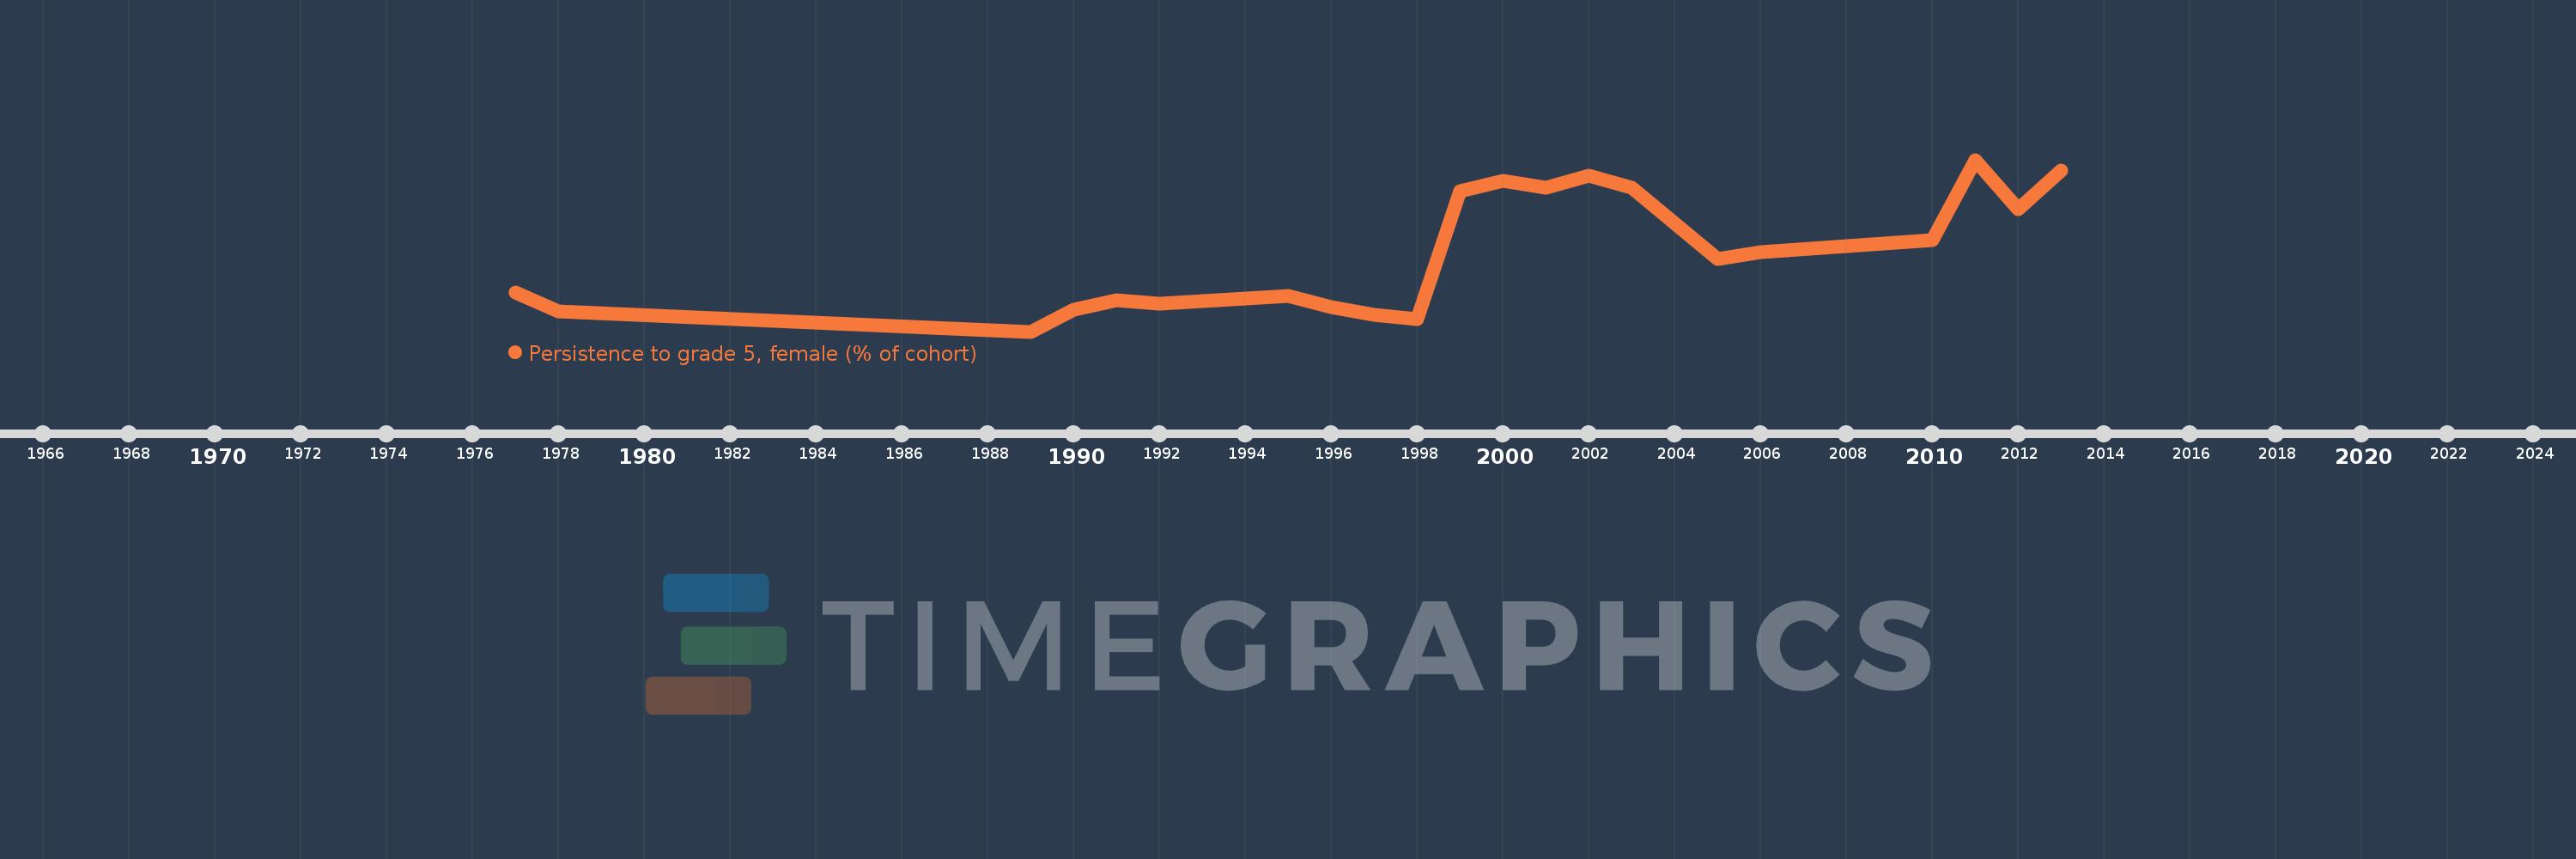
Nesta escala de tempo está apresentado um gráfico de 1977 ano até 2013 ano Chad. Dados de 1976 ano ausente. O número de observações reais por data: 21.
Fonte (nome):
Indicadores de desenvolvimento mundial
Fonte (organização):
United Nations Educational, Scientific, and Cultural Organization (UNESCO) Institute for Statistics.
Categorias:
Education, Gender
Foi atualizado:
23 abr 2017 ano
Indicadores de alterações dos valores ao longo dos anos
Em média:
33.814
Mínimo:
14.91
1 jan 1989 ano
Máximo:
55.915
1 jan 2011 ano
Na data de observação
Valor
Mudança absoluta
A alteração em relação ao valor anterior
1 jan 1977 ano
24.174
+24.174
0.0%
1 jan 1978 ano
19.706
-4.469
-18.49%
1 jan 1989 ano
14.91
-4.796
-24.34%
1 jan 1990 ano
20.208
+5.298
35.53%
1 jan 1991 ano
22.356
+2.148
10.63%
1 jan 1992 ano
21.524
-0.833
-3.72%
1 jan 1995 ano
23.329
+1.805
8.39%
1 jan 1996 ano
20.695
-2.634
-11.29%
1 jan 1997 ano
18.907
-1.788
-8.64%
1 jan 1998 ano
17.947
-0.96
-5.08%
1 jan 1999 ano
48.456
+30.508
169.99%
1 jan 2000 ano
50.926
+2.47
5.1%
1 jan 2001 ano
49.276
-1.65
-3.24%
1 jan 2002 ano
52.084
+2.808
5.7%
1 jan 2003 ano
49.334
-2.75
-5.28%
1 jan 2005 ano
32.326
-17.009
-34.48%
1 jan 2006 ano
33.862
+1.536
4.75%
1 jan 2010 ano
36.65
+2.788
8.23%
1 jan 2011 ano
55.915
+19.265
52.57%
1 jan 2012 ano
44.198
-11.717
-20.96%
1 jan 2013 ano
53.308
+9.11
20.61%
Classificação de países por estatísticas atuais por anos

Comentários:

Enviar
PremiumAbout & FeedbackAcordoPrivacidade
logo
© 2022 Selected Technologies LLC – Morgan Hill, California