33
/pt/
AIzaSyAYiBZKx7MnpbEhh9jyipgxe19OcubqV5w
August 1, 2025
214682
Norway
NOR
true
2
1
Persistence to grade 5, female (% of cohort)
2014,2013,2012,2011,2010,2009,2008,2007,2006,2005,2004,2003,2002,2001,2000,1999,1991,1990,1978,1977,1976,1975,1974,1972
Download
Biblioteca de estatísticas globais →Norway →

Persistence to grade 5, female (% of cohort)

Estas estatísticas em outros países:

AfghanistanAlbaniaAlgeriaAndorraAngolaAntigua and BarbudaArab WorldArgentinaArubaBahamas, TheBahrainBangladeshBarbadosBelgiumBelizeBeninBermudaBhutanBoliviaBosnia and HerzegovinaBotswanaBrunei DarussalamBurkina FasoBurundiCabo VerdeCambodiaCameroonCanadaCaribbean small statesCayman IslandsCentral African RepublicChadChileChinaColombiaComorosCongo, Dem. Rep.Congo, Rep.Costa RicaCote d'IvoireCubaCyprusCzech RepublicDenmarkDjiboutiDominicaDominican RepublicEarly-demographic dividendEast Asia & PacificEast Asia & Pacific (excluding high income)East Asia & Pacific (IDA & IBRD countries)EcuadorEgypt, Arab Rep.El SalvadorEquatorial GuineaEritreaEstoniaEthiopiaFijiFinlandFranceGabonGambia, TheGeorgiaGhanaGreeceGrenadaGuatemalaGuineaGuinea-BissauGuyanaHaitiHeavily indebted poor countries (HIPC)HondurasHong Kong SAR, ChinaHungaryIcelandIDA blendIDA onlyIDA totalIndiaIndonesiaIran, Islamic Rep.IraqIrelandIsraelItalyJamaicaJapanJordanKenyaKiribatiKorea, Rep.KuwaitLao PDRLate-demographic dividendLatviaLeast developed countries: UN classificationLebanonLesothoLiberiaLibyaLiechtensteinLow incomeLower middle incomeLuxembourgMacao SAR, ChinaMadagascarMalawiMalaysiaMaldivesMaliMaltaMarshall IslandsMauritaniaMauritiusMexicoMiddle East & North AfricaMiddle East & North Africa (excluding high income)Middle East & North Africa (IDA & IBRD countries)MontenegroMoroccoMozambiqueMyanmarNamibiaNepalNetherlandsNicaraguaNigerNigeriaNorwayOmanOther small statesPacific island small statesPakistanPanamaPapua New GuineaParaguayPeruPhilippinesPolandPortugalPre-demographic dividendQatarRwandaSamoaSan MarinoSao Tome and PrincipeSaudi ArabiaSenegalSeychellesSierra LeoneSingaporeSloveniaSolomon IslandsSouth AfricaSouth AsiaSouth Asia (IDA & IBRD)SpainSri LankaSt. Kitts and NevisSt. LuciaSt. Vincent and the GrenadinesSub-Saharan Africa Sub-Saharan Africa (excluding high income)Sub-Saharan Africa (IDA & IBRD countries)SudanSurinameSwazilandSwedenSwitzerlandSyrian Arab RepublicTanzaniaThailandTimor-LesteTogoTongaTrinidad and TobagoTunisiaTurkeyUgandaUnited Arab EmiratesUpper middle incomeUruguayVanuatuVenezuela, RBVietnamYemen, Rep.ZambiaZimbabwe

Linha do tempo:

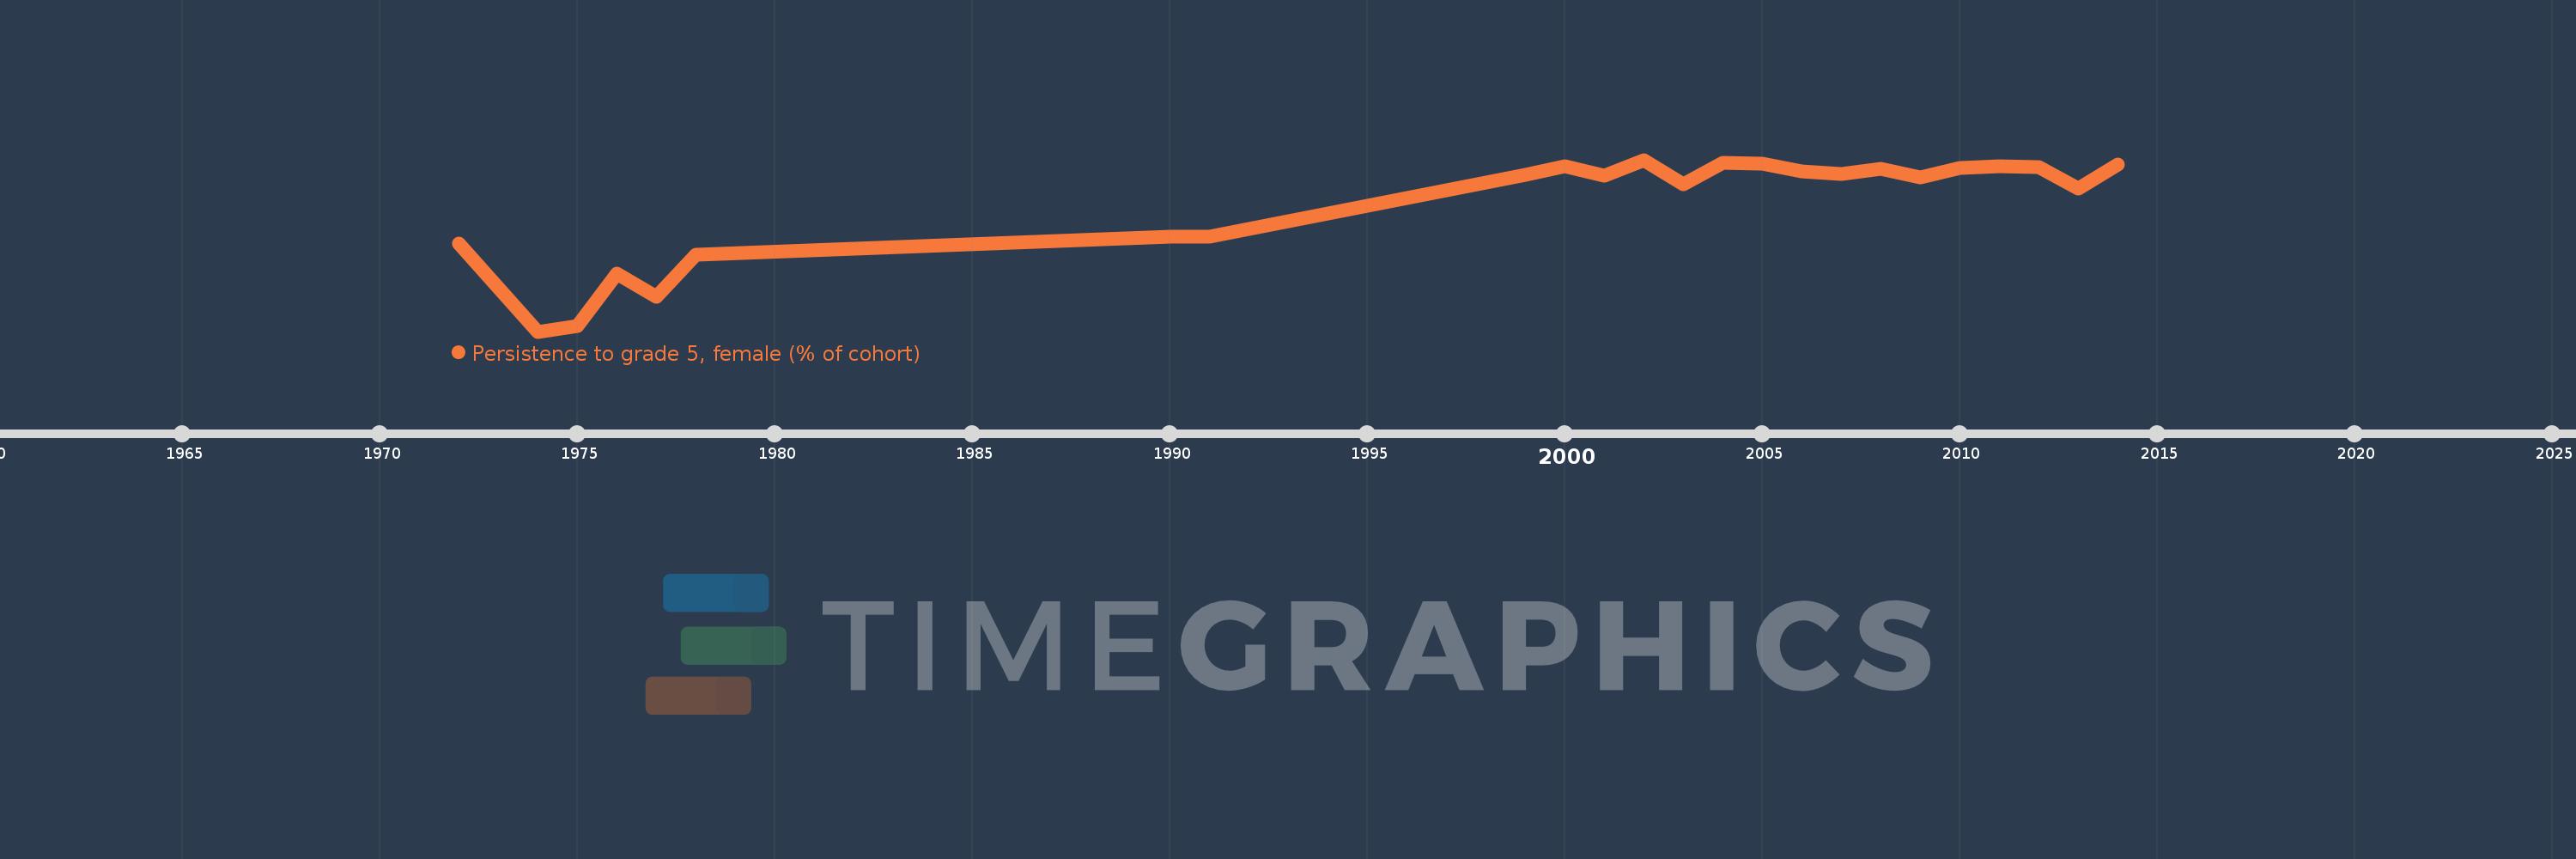
Nesta escala de tempo está apresentado um gráfico de 1972 ano até 2014 ano Norway. Dados de 1971 ano ausente. O número de observações reais por data: 24.

Fonte (nome):

Indicadores de desenvolvimento mundial

Fonte (organização):

United Nations Educational, Scientific, and Cultural Organization (UNESCO) Institute for Statistics.

Categorias:

Education, Gender

Foi atualizado:

23 abr 2017 ano

Indicadores de alterações dos valores ao longo dos anos

Em média:
97.845
Mínimo:
91.9
1 jan 1974 ano
Máximo:
100.0
1 jan 2002 ano
Na data de observação
Valor
Mudança absoluta
A alteração em relação ao valor anterior
1 jan 1972 ano
96.069
+96.069
0.0%
1 jan 1974 ano
91.9
-4.169
-4.34%
1 jan 1975 ano
92.157
+0.257
0.28%
1 jan 1976 ano
94.642
+2.486
2.7%
1 jan 1977 ano
93.549
-1.094
-1.16%
1 jan 1978 ano
95.543
+1.994
2.13%
1 jan 1990 ano
96.383
+0.84
0.88%
1 jan 1991 ano
96.381
-0.002
0.0%
1 jan 1999 ano
99.279
+2.898
3.01%
1 jan 2000 ano
99.714
+0.435
0.44%
1 jan 2001 ano
99.269
-0.445
-0.45%
1 jan 2002 ano
100.0
+0.731
0.74%
1 jan 2003 ano
98.854
-1.146
-1.15%
1 jan 2004 ano
99.851
+0.997
1.01%
1 jan 2005 ano
99.831
-0.02
-0.02%
1 jan 2006 ano
99.446
-0.385
-0.39%
1 jan 2007 ano
99.317
-0.129
-0.13%
1 jan 2008 ano
99.592
+0.275
0.28%
1 jan 2009 ano
99.163
-0.428
-0.43%
1 jan 2010 ano
99.599
+0.435
0.44%
1 jan 2011 ano
99.68
+0.082
0.08%
1 jan 2012 ano
99.652
-0.029
-0.03%
1 jan 2013 ano
98.649
-1.003
-1.01%
1 jan 2014 ano
99.764
+1.115
1.13%

Classificação de países por estatísticas atuais por anos