33
/pt/
AIzaSyAYiBZKx7MnpbEhh9jyipgxe19OcubqV5w
August 1, 2025
102865
Central African Republic
CAF
true
2
1
Persistence to grade 5, female (% of cohort)
2012,2011,2010,2009,1992,1991,1990,1989,1988,1987,1984,1983,1982,1979,1977,1975,1974,1973,1972
Download
Biblioteca de estatísticas globais →Central African Republic →

Persistence to grade 5, female (% of cohort)

Estas estatísticas em outros países:

AfghanistanAlbaniaAlgeriaAndorraAngolaAntigua and BarbudaArab WorldArgentinaArubaBahamas, TheBahrainBangladeshBarbadosBelgiumBelizeBeninBermudaBhutanBoliviaBosnia and HerzegovinaBotswanaBrunei DarussalamBurkina FasoBurundiCabo VerdeCambodiaCameroonCanadaCaribbean small statesCayman IslandsCentral African RepublicChadChileChinaColombiaComorosCongo, Dem. Rep.Congo, Rep.Costa RicaCote d'IvoireCubaCyprusCzech RepublicDenmarkDjiboutiDominicaDominican RepublicEarly-demographic dividendEast Asia & PacificEast Asia & Pacific (excluding high income)East Asia & Pacific (IDA & IBRD countries)EcuadorEgypt, Arab Rep.El SalvadorEquatorial GuineaEritreaEstoniaEthiopiaFijiFinlandFranceGabonGambia, TheGeorgiaGhanaGreeceGrenadaGuatemalaGuineaGuinea-BissauGuyanaHaitiHeavily indebted poor countries (HIPC)HondurasHong Kong SAR, ChinaHungaryIcelandIDA blendIDA onlyIDA totalIndiaIndonesiaIran, Islamic Rep.IraqIrelandIsraelItalyJamaicaJapanJordanKenyaKiribatiKorea, Rep.KuwaitLao PDRLate-demographic dividendLatviaLeast developed countries: UN classificationLebanonLesothoLiberiaLibyaLiechtensteinLow incomeLower middle incomeLuxembourgMacao SAR, ChinaMadagascarMalawiMalaysiaMaldivesMaliMaltaMarshall IslandsMauritaniaMauritiusMexicoMiddle East & North AfricaMiddle East & North Africa (excluding high income)Middle East & North Africa (IDA & IBRD countries)MontenegroMoroccoMozambiqueMyanmarNamibiaNepalNetherlandsNicaraguaNigerNigeriaNorwayOmanOther small statesPacific island small statesPakistanPanamaPapua New GuineaParaguayPeruPhilippinesPolandPortugalPre-demographic dividendQatarRwandaSamoaSan MarinoSao Tome and PrincipeSaudi ArabiaSenegalSeychellesSierra LeoneSingaporeSloveniaSolomon IslandsSouth AfricaSouth AsiaSouth Asia (IDA & IBRD)SpainSri LankaSt. Kitts and NevisSt. LuciaSt. Vincent and the GrenadinesSub-Saharan Africa Sub-Saharan Africa (excluding high income)Sub-Saharan Africa (IDA & IBRD countries)SudanSurinameSwazilandSwedenSwitzerlandSyrian Arab RepublicTanzaniaThailandTimor-LesteTogoTongaTrinidad and TobagoTunisiaTurkeyUgandaUnited Arab EmiratesUpper middle incomeUruguayVanuatuVenezuela, RBVietnamYemen, Rep.ZambiaZimbabwe

Linha do tempo:

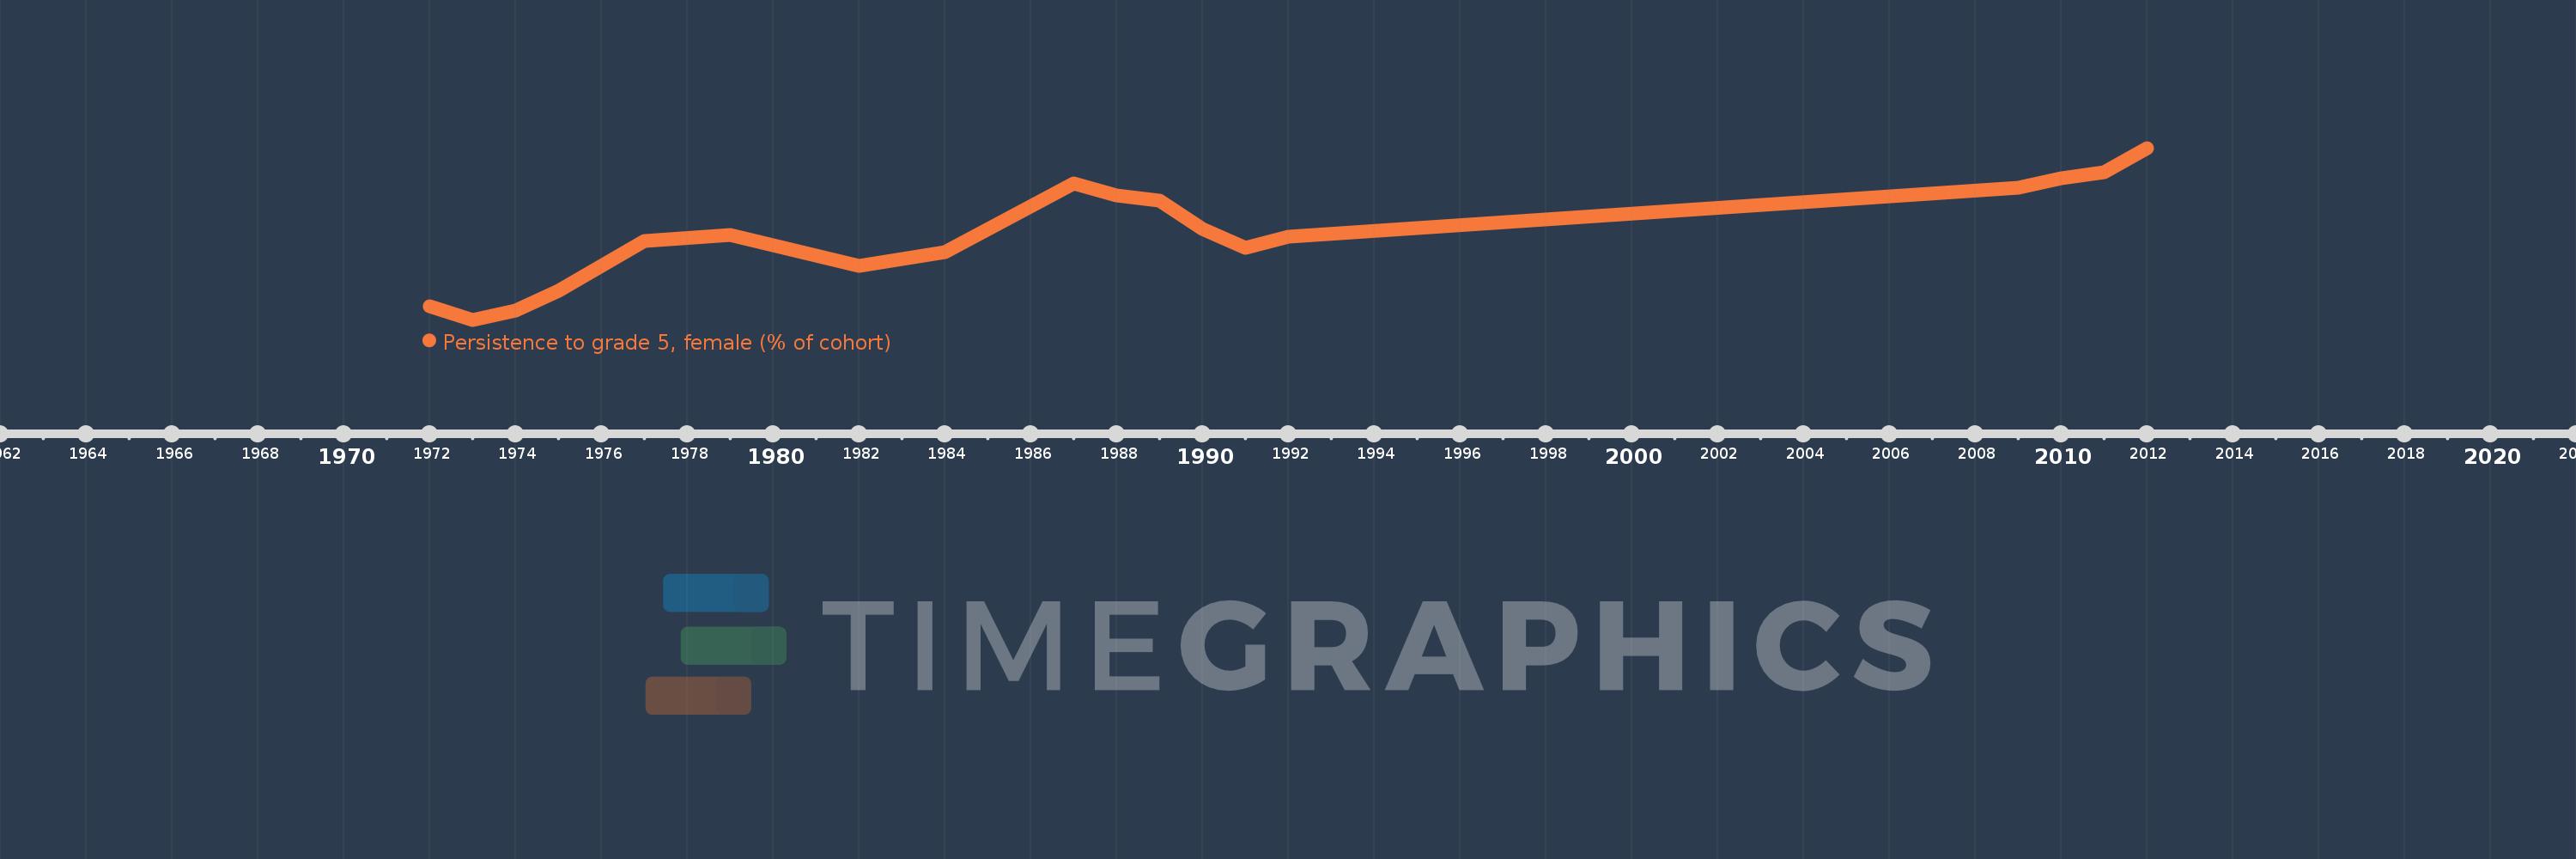
Nesta escala de tempo está apresentado um gráfico de 1972 ano até 2012 ano Central African Republic. Dados de 1971 ano ausente. O número de observações reais por data: 19.

Fonte (nome):

Indicadores de desenvolvimento mundial

Fonte (organização):

United Nations Educational, Scientific, and Cultural Organization (UNESCO) Institute for Statistics.

Categorias:

Education, Gender

Foi atualizado:

23 abr 2017 ano

Indicadores de alterações dos valores ao longo dos anos

Em média:
39.549
Mínimo:
23.416
1 jan 1973 ano
Máximo:
55.988
1 jan 2012 ano
Na data de observação
Valor
Mudança absoluta
A alteração em relação ao valor anterior
1 jan 1972 ano
25.967
+25.967
0.0%
1 jan 1973 ano
23.416
-2.551
-9.82%
1 jan 1974 ano
25.119
+1.703
7.27%
1 jan 1975 ano
28.84
+3.721
14.81%
1 jan 1977 ano
38.423
+9.583
33.23%
1 jan 1979 ano
39.569
+1.146
2.98%
1 jan 1982 ano
33.656
-5.913
-14.94%
1 jan 1983 ano
34.984
+1.327
3.94%
1 jan 1984 ano
36.307
+1.323
3.78%
1 jan 1987 ano
49.308
+13.001
35.81%
1 jan 1988 ano
46.97
-2.338
-4.74%
1 jan 1989 ano
45.932
-1.038
-2.21%
1 jan 1990 ano
40.684
-5.248
-11.42%
1 jan 1991 ano
37.041
-3.643
-8.96%
1 jan 1992 ano
39.189
+2.149
5.8%
1 jan 2009 ano
48.466
+9.277
23.67%
1 jan 2010 ano
50.217
+1.751
3.61%
1 jan 2011 ano
51.35
+1.133
2.26%
1 jan 2012 ano
55.988
+4.638
9.03%

Classificação de países por estatísticas atuais por anos