30
/it/
AIzaSyAYiBZKx7MnpbEhh9jyipgxe19OcubqV5w
April 1, 2024
99842
Cameroon
CMR
true
2
1
Expenditure on tertiary as % of government expenditure on education (%)
2014,2013,2012,2011,2010,2009,2008,2007,2006,2005
Download
Biblioteca di statistiche globali →Cameroon →

Expenditure on tertiary as % of government expenditure on education (%)

Queste statistiche in altri paesi:

AlbaniaAlgeriaAmerican SamoaAndorraAngolaAntigua and BarbudaArgentinaArmeniaArubaAustraliaAustriaAzerbaijanBangladeshBarbadosBelarusBelgiumBelizeBeninBermudaBhutanBoliviaBotswanaBrazilBritish Virgin IslandsBrunei DarussalamBulgariaBurkina FasoBurundiCabo VerdeCambodiaCameroonCanadaCaribbean small statesCentral African RepublicCentral Europe and the BalticsChadChileChinaColombiaComorosCongo, Dem. Rep.Congo, Rep.Costa RicaCote d'IvoireCroatiaCubaCuracaoCyprusCzech RepublicDenmarkDjiboutiDominican RepublicEast Asia & PacificEast Asia & Pacific (excluding high income)East Asia & Pacific (IDA & IBRD countries)EcuadorEl SalvadorEquatorial GuineaEritreaEstoniaEthiopiaEuro areaEurope & Central AsiaEurope & Central Asia (excluding high income)Europe & Central Asia (IDA & IBRD countries)European UnionFijiFinlandFranceGabonGambia, TheGeorgiaGermanyGhanaGreeceGrenadaGuatemalaGuineaGuinea-BissauGuyanaHeavily indebted poor countries (HIPC)High incomeHondurasHong Kong SAR, ChinaHungaryIBRD onlyIcelandIDA & IBRD totalIDA blendIDA onlyIDA totalIndiaIndonesiaIran, Islamic Rep.IrelandIsraelItalyJamaicaJapanJordanKazakhstanKenyaKorea, Rep.KuwaitKyrgyz RepublicLao PDRLate-demographic dividendLatin America & Caribbean Latin America & Caribbean (excluding high income)Latin America & the Caribbean (IDA & IBRD countries)LatviaLeast developed countries: UN classificationLebanonLesothoLiberiaLibyaLiechtensteinLithuaniaLow & middle incomeLow incomeLower middle incomeMacao SAR, ChinaMacedonia, FYRMadagascarMalawiMalaysiaMaldivesMaliMaltaMarshall IslandsMauritaniaMauritiusMexicoMiddle incomeMoldovaMonacoMongoliaMoroccoMozambiqueNamibiaNepalNetherlandsNew ZealandNicaraguaNigerNorth AmericaNorwayOECD membersOmanOther small statesPakistanPalauPanamaParaguayPeruPhilippinesPolandPortugalPost-demographic dividendPre-demographic dividendPuerto RicoRomaniaRussian FederationRwandaSamoaSan MarinoSao Tome and PrincipeSaudi ArabiaSenegalSerbiaSeychellesSierra LeoneSingaporeSlovak RepublicSloveniaSmall statesSouth AfricaSouth AsiaSouth Asia (IDA & IBRD)South SudanSpainSri LankaSt. Kitts and NevisSt. LuciaSt. Vincent and the GrenadinesSub-Saharan Africa Sub-Saharan Africa (excluding high income)Sub-Saharan Africa (IDA & IBRD countries)SwazilandSwedenSwitzerlandSyrian Arab RepublicTajikistanTanzaniaThailandTimor-LesteTogoTongaTunisiaTurkeyTurkmenistanTurks and Caicos IslandsUgandaUkraineUnited KingdomUnited StatesUpper middle incomeUruguayVanuatuVenezuela, RBVietnamWorldZambiaZimbabwe

Linea del tempo:

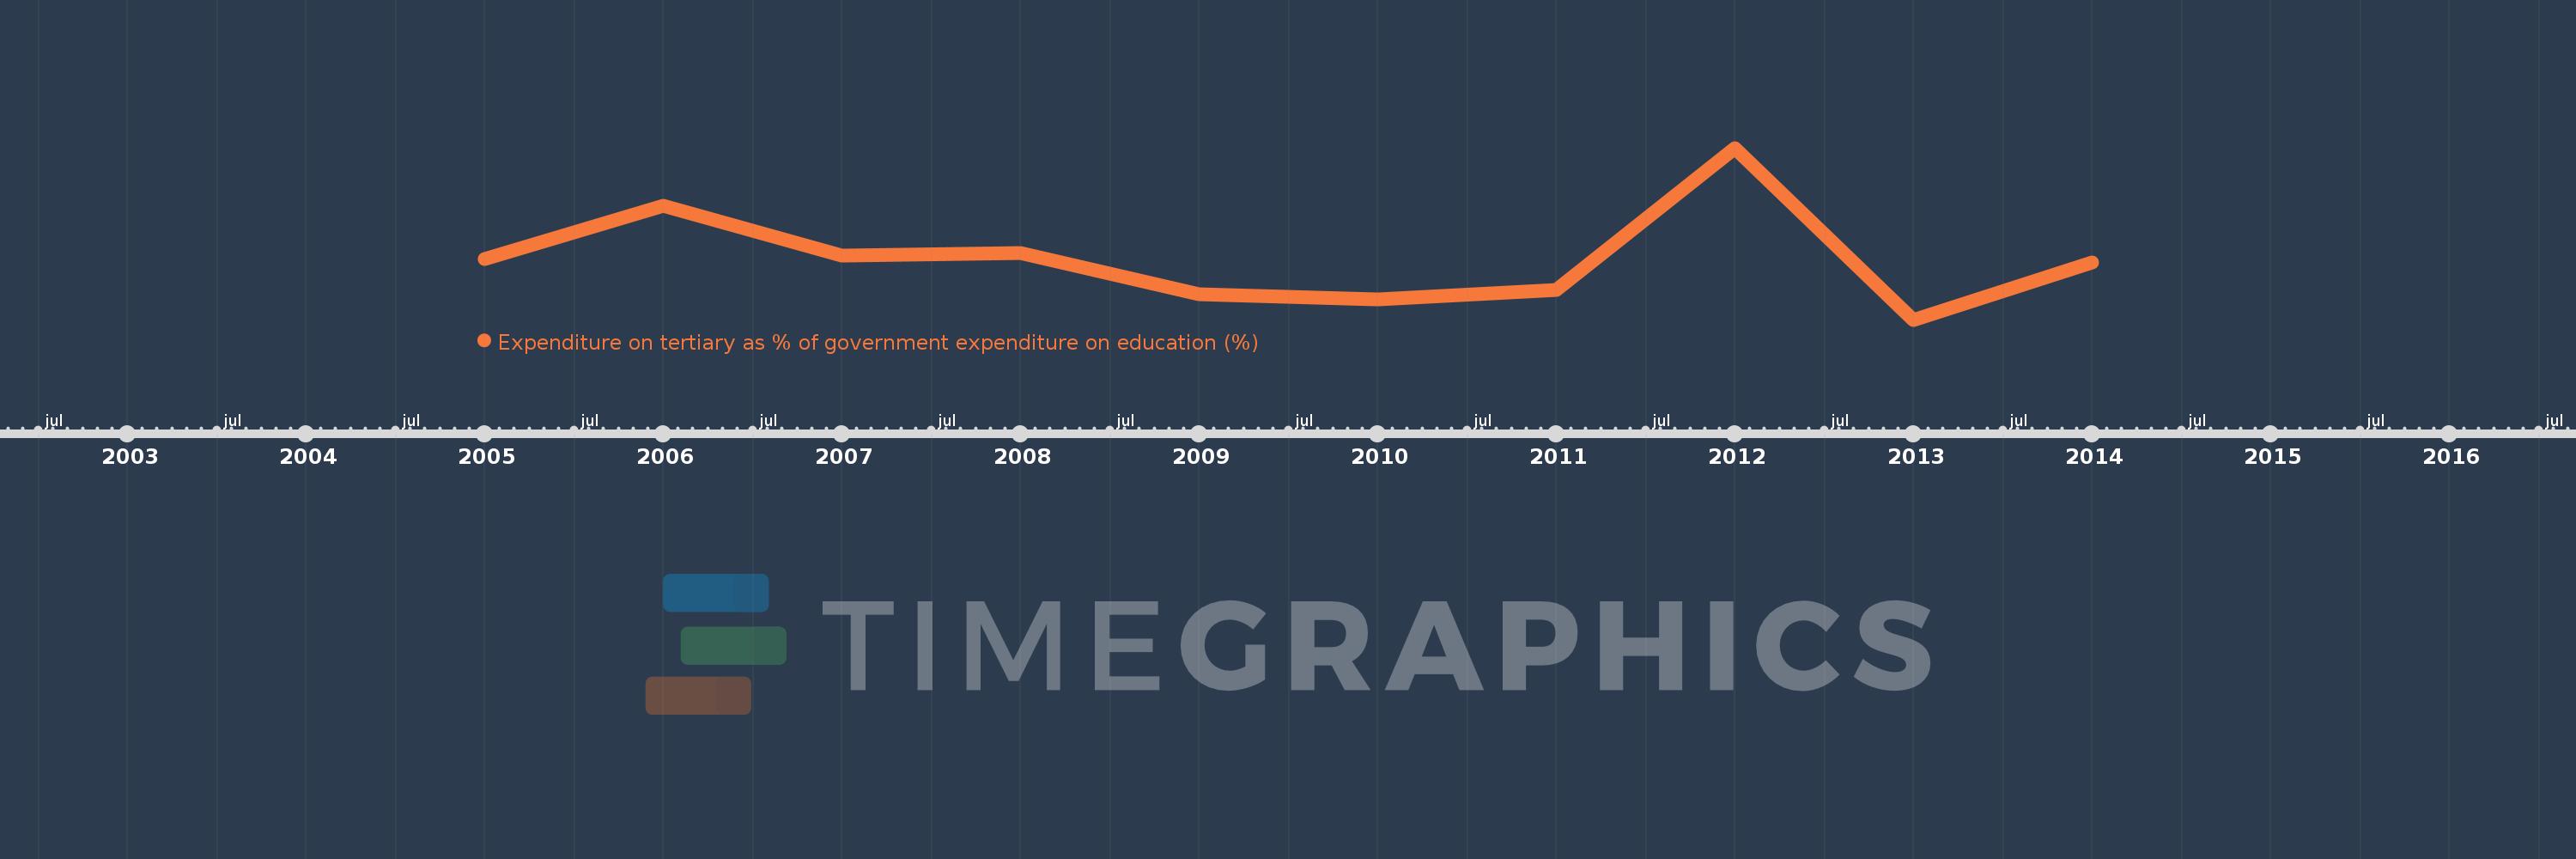
Questa scala temporale mostra un grafico dal 2005 anno al 2014 anno. Cameroon. I dati fino ad 2004 anno non disponibili. Il numero di osservazioni attuali secondo i date: 10.

La fonte (nome):

Indicatori dello sviluppo mondiale

La fonte (organizzazione):

UNESCO Institute for Statistics

Categorie:

Education

sono stati aggiornati

23 apr 2017 anni

Indicatori delle variazioni dei valori per anni

In media:
10.371
Minima:
7.77
1 gen 2013 anni
Massimo:
15.094
1 gen 2012 anni
Alla data di osservazione
Valore
Variazione assoluta
La variazione rispetto al valore precedente
1 gen 2005 anni
10.362
+10.362
0.0%
1 gen 2006 anni
12.643
+2.281
22.01%
1 gen 2007 anni
10.498
-2.145
-16.97%
1 gen 2008 anni
10.615
+0.117
1.11%
1 gen 2009 anni
8.851
-1.764
-16.61%
1 gen 2010 anni
8.626
-0.226
-2.55%
1 gen 2011 anni
9.043
+0.417
4.83%
1 gen 2012 anni
15.094
+6.051
66.91%
1 gen 2013 anni
7.77
-7.324
-48.52%
1 gen 2014 anni
10.207
+2.437
31.37%

Classificazione dei paesi secondo i statistiche attuali per anni