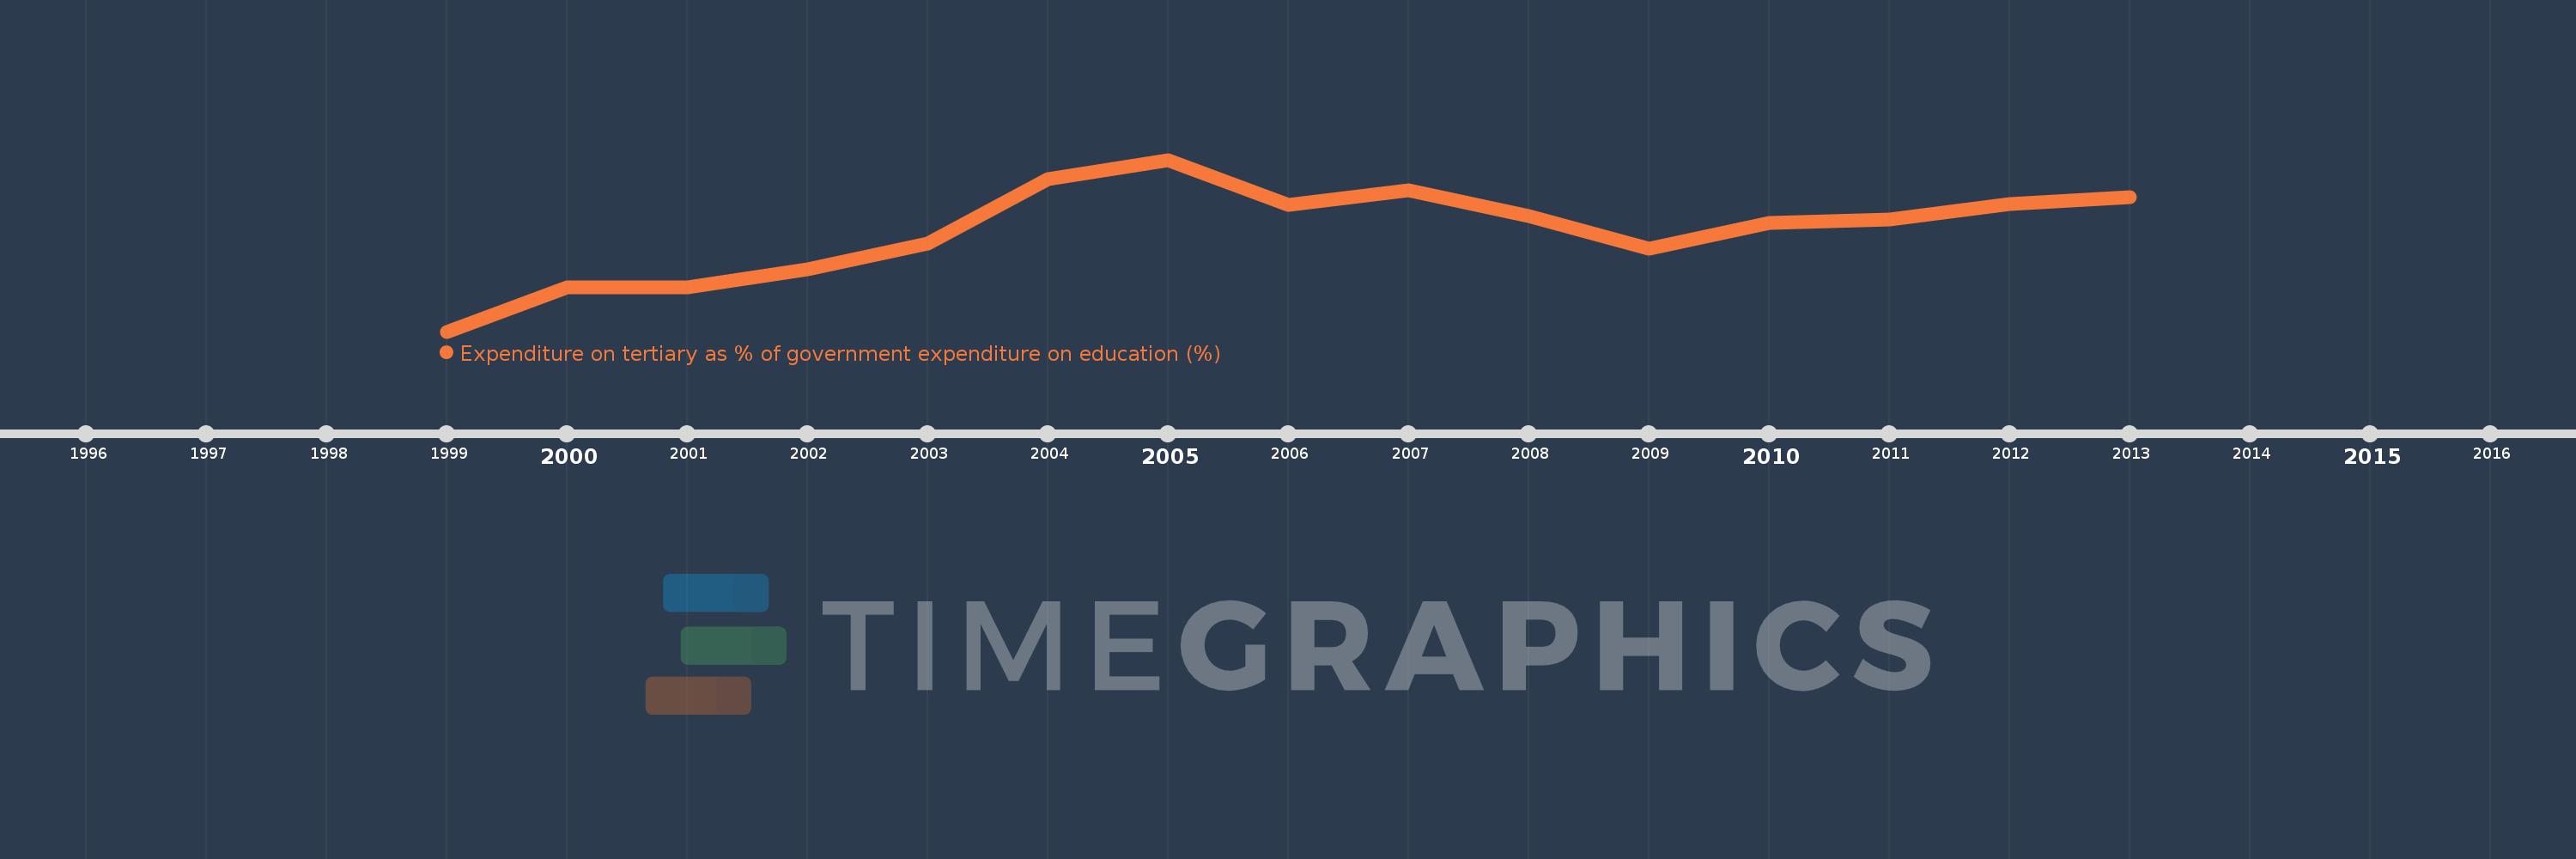
Questa scala temporale mostra un grafico dal 1999 anno al 2013 anno. Switzerland. I dati fino ad 1998 anno non disponibili. Il numero di osservazioni attuali secondo i date: 15.
La fonte (nome):
Indicatori dello sviluppo mondiale
La fonte (organizzazione):
UNESCO Institute for Statistics
Categorie:
Education
sono stati aggiornati
23 apr 2017 anni
Indicatori delle variazioni dei valori per anni
In media:
24.804
Minima:
20.345
1 gen 1999 anni
Massimo:
27.942
1 gen 2005 anni
Alla data di osservazione
Valore
Variazione assoluta
La variazione rispetto al valore precedente
1 gen 1999 anni
20.345
+20.345
0.0%
1 gen 2000 anni
22.309
+1.964
9.65%
1 gen 2001 anni
22.292
-0.017
-0.07%
1 gen 2002 anni
23.111
+0.819
3.67%
1 gen 2003 anni
24.225
+1.114
4.82%
1 gen 2004 anni
27.085
+2.86
11.8%
1 gen 2005 anni
27.942
+0.857
3.16%
1 gen 2006 anni
25.96
-1.982
-7.09%
1 gen 2007 anni
26.593
+0.634
2.44%
1 gen 2008 anni
25.451
-1.142
-4.29%
1 gen 2009 anni
23.999
-1.452
-5.71%
1 gen 2010 anni
25.143
+1.144
4.77%
1 gen 2011 anni
25.307
+0.164
0.65%
1 gen 2012 anni
25.996
+0.689
2.72%
1 gen 2013 anni
26.308
+0.312
1.2%
Classificazione dei paesi secondo i statistiche attuali per anni