Download Queste statistiche in altri paesi:
Linea del tempo:
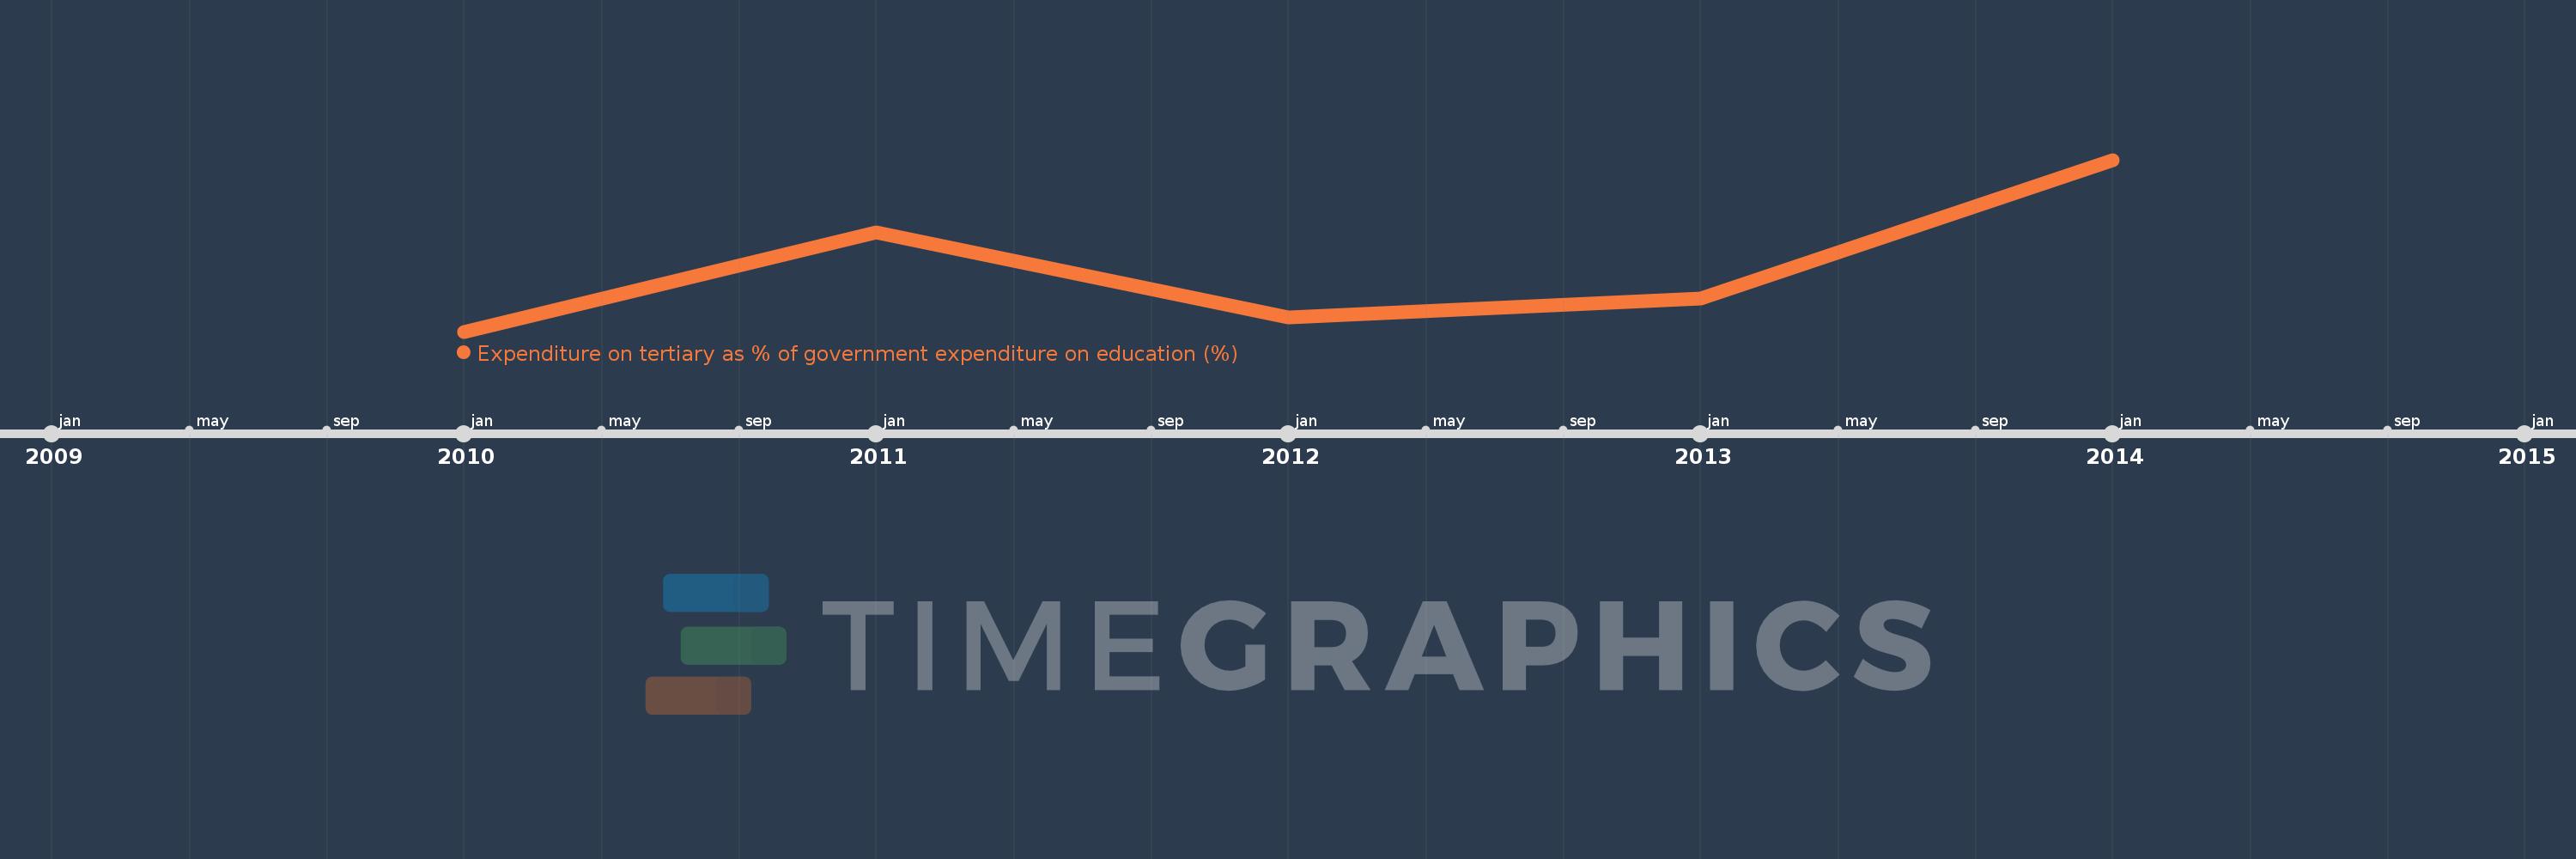
Questa scala temporale mostra un grafico dal 2010 anno al 2014 anno. Low income. I dati fino ad 2009 anno non disponibili. Il numero di osservazioni attuali secondo i date: 5.
La fonte (nome):
Indicatori dello sviluppo mondiale
La fonte (organizzazione):
UNESCO Institute for Statistics
Categorie:
Education
sono stati aggiornati
23 apr 2017 anni
Indicatori delle variazioni dei valori per anni
Minima:
17.083
1 gen 2010 anni
Massimo:
21.718
1 gen 2014 anni
Alla data di osservazione
Valore
Variazione assoluta
La variazione rispetto al valore precedente
1 gen 2010 anni
17.083
+17.083
0.0%
1 gen 2011 anni
19.759
+2.675
15.66%
1 gen 2012 anni
17.46
-2.299
-11.63%
1 gen 2013 anni
17.982
+0.522
2.99%
1 gen 2014 anni
21.718
+3.736
20.78%
Classificazione dei paesi secondo i statistiche attuali per anni