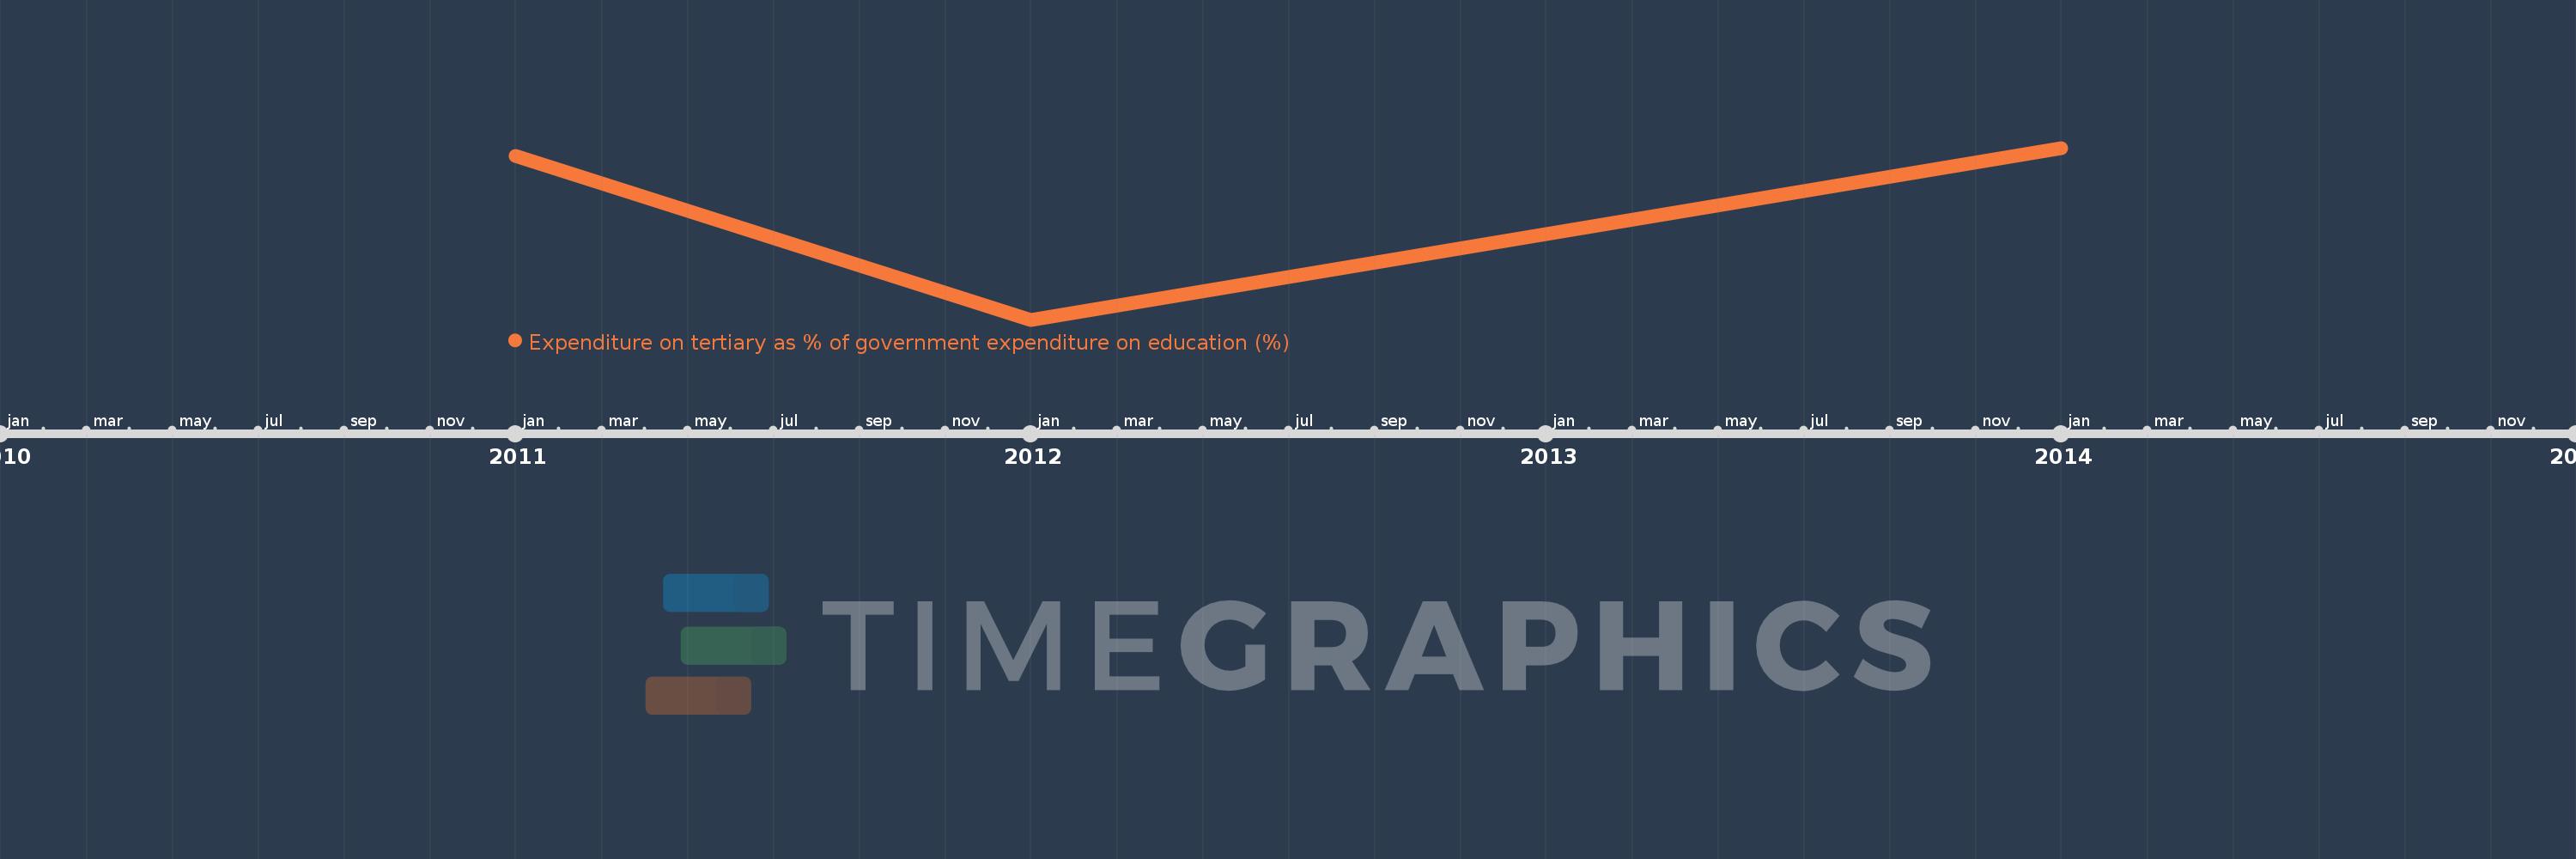
Questa scala temporale mostra un grafico dal 2011 anno al 2014 anno. Sub-Saharan Africa (excluding high income). I dati fino ad 2010 anno non disponibili. Il numero di osservazioni attuali secondo i date: 3.
La fonte (nome):
Indicatori dello sviluppo mondiale
La fonte (organizzazione):
UNESCO Institute for Statistics
Categorie:
Education
sono stati aggiornati
23 apr 2017 anni
Indicatori delle variazioni dei valori per anni
In media:
17.998
Minima:
15.312
1 gen 2012 anni
Massimo:
19.441
1 gen 2014 anni
Alla data di osservazione
Valore
Variazione assoluta
La variazione rispetto al valore precedente
1 gen 2011 anni
19.24
+19.24
0.0%
1 gen 2012 anni
15.312
-3.928
-20.42%
1 gen 2014 anni
19.441
+4.129
26.97%
Classificazione dei paesi secondo i statistiche attuali per anni