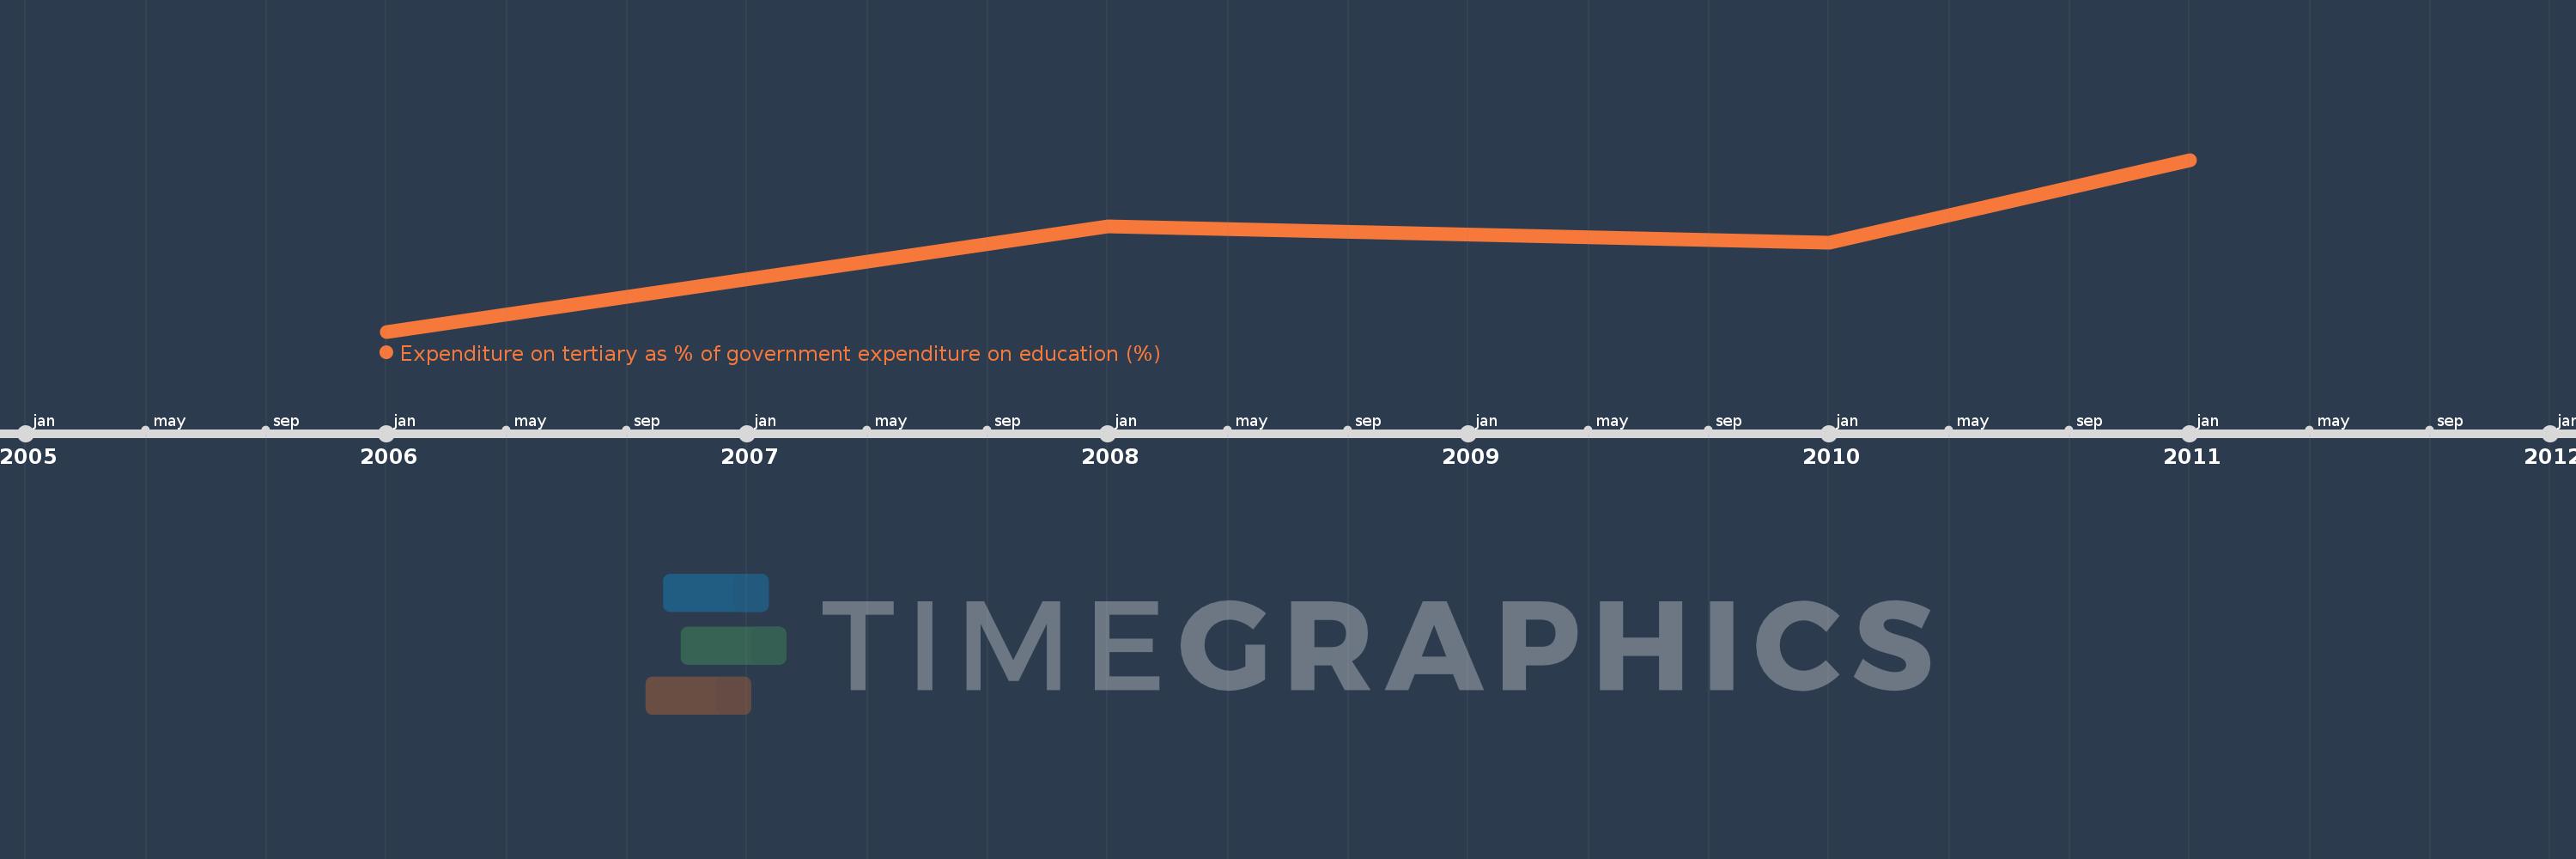
Questa scala temporale mostra un grafico dal 2006 anno al 2011 anno. St. Vincent and the Grenadines. I dati fino ad 2005 anno non disponibili. Il numero di osservazioni attuali secondo i date: 4.
La fonte (nome):
Indicatori dello sviluppo mondiale
La fonte (organizzazione):
UNESCO Institute for Statistics
Categorie:
Education
sono stati aggiornati
23 apr 2017 anni
Indicatori delle variazioni dei valori per anni
In media:
5.466
Minima:
3.706
1 gen 2006 anni
Massimo:
7.01
1 gen 2011 anni
Alla data di osservazione
Valore
Variazione assoluta
La variazione rispetto al valore precedente
1 gen 2006 anni
3.706
+3.706
0.0%
1 gen 2008 anni
5.73
+2.024
54.6%
1 gen 2010 anni
5.415
-0.314
-5.49%
1 gen 2011 anni
7.01
+1.595
29.45%
Classificazione dei paesi secondo i statistiche attuali per anni