33
/it/
AIzaSyAYiBZKx7MnpbEhh9jyipgxe19OcubqV5w
August 1, 2025
98958
Cambodia
KHM
true
2
1
Net financial flows, IDA (NFL, current US$)
2016,2015,2014,2013,2012,2011,2010,2009,2008,2007,2006,2005,2004,2003,2002,2001,2000,1999,1998,1997,1996,1995
Download
Biblioteca di statistiche globali →Cambodia →

Net financial flows, IDA (NFL, current US$)

Queste statistiche in altri paesi:

AfghanistanAlbaniaAngolaArmeniaAzerbaijanBangladeshBeninBhutanBoliviaBosnia and HerzegovinaBotswanaBurkina FasoBurundiCabo VerdeCambodiaCameroonCaribbean small statesCentral African RepublicCentral Europe and the BalticsChadChinaColombiaComorosCongo, Dem. Rep.Congo, Rep.Costa RicaCote d'IvoireCroatiaCzech RepublicDjiboutiDominicaDominican RepublicEarly-demographic dividendEast Asia & PacificEast Asia & Pacific (excluding high income)East Asia & Pacific (IDA & IBRD countries)EcuadorEgypt, Arab Rep.El SalvadorEquatorial GuineaEritreaEstoniaEthiopiaEurope & Central AsiaEurope & Central Asia (excluding high income)Europe & Central Asia (IDA & IBRD countries)Fragile and conflict affected situationsGambia, TheGeorgiaGhanaGreeceGrenadaGuineaGuinea-BissauGuyanaHaitiHondurasHungaryIBRD onlyIDA & IBRD totalIDA blendIDA onlyIDA totalIndiaIndonesiaJordanKenyaKorea, Rep.KosovoKyrgyz RepublicLao PDRLate-demographic dividendLatin America & Caribbean Latin America & Caribbean (excluding high income)Latin America & the Caribbean (IDA & IBRD countries)LesothoLiberiaLow & middle incomeLow incomeLower middle incomeMacedonia, FYRMadagascarMalawiMaldivesMaliMauritaniaMauritiusMiddle East & North AfricaMiddle East & North Africa (excluding high income)Middle East & North Africa (IDA & IBRD countries)Middle incomeMoldovaMongoliaMontenegroMoroccoMozambiqueMyanmarNepalNicaraguaNigerNigeriaOmanOther small statesPacific island small statesPakistanPapua New GuineaParaguayPhilippinesPolandPre-demographic dividendRwandaSamoaSao Tome and PrincipeSenegalSerbiaSeychellesSierra LeoneSlovak RepublicSloveniaSmall statesSolomon IslandsSomaliaSouth AsiaSouth Asia (IDA & IBRD)Sri LankaSt. Kitts and NevisSt. LuciaSt. Vincent and the GrenadinesSub-Saharan Africa Sub-Saharan Africa (excluding high income)Sub-Saharan Africa (IDA & IBRD countries)SudanSwazilandSyrian Arab RepublicTajikistanTanzaniaThailandTogoTongaTrinidad and TobagoTunisiaTurkeyUgandaUpper middle incomeUzbekistanVanuatuVietnamYemen, Rep.ZambiaZimbabwe

Linea del tempo:

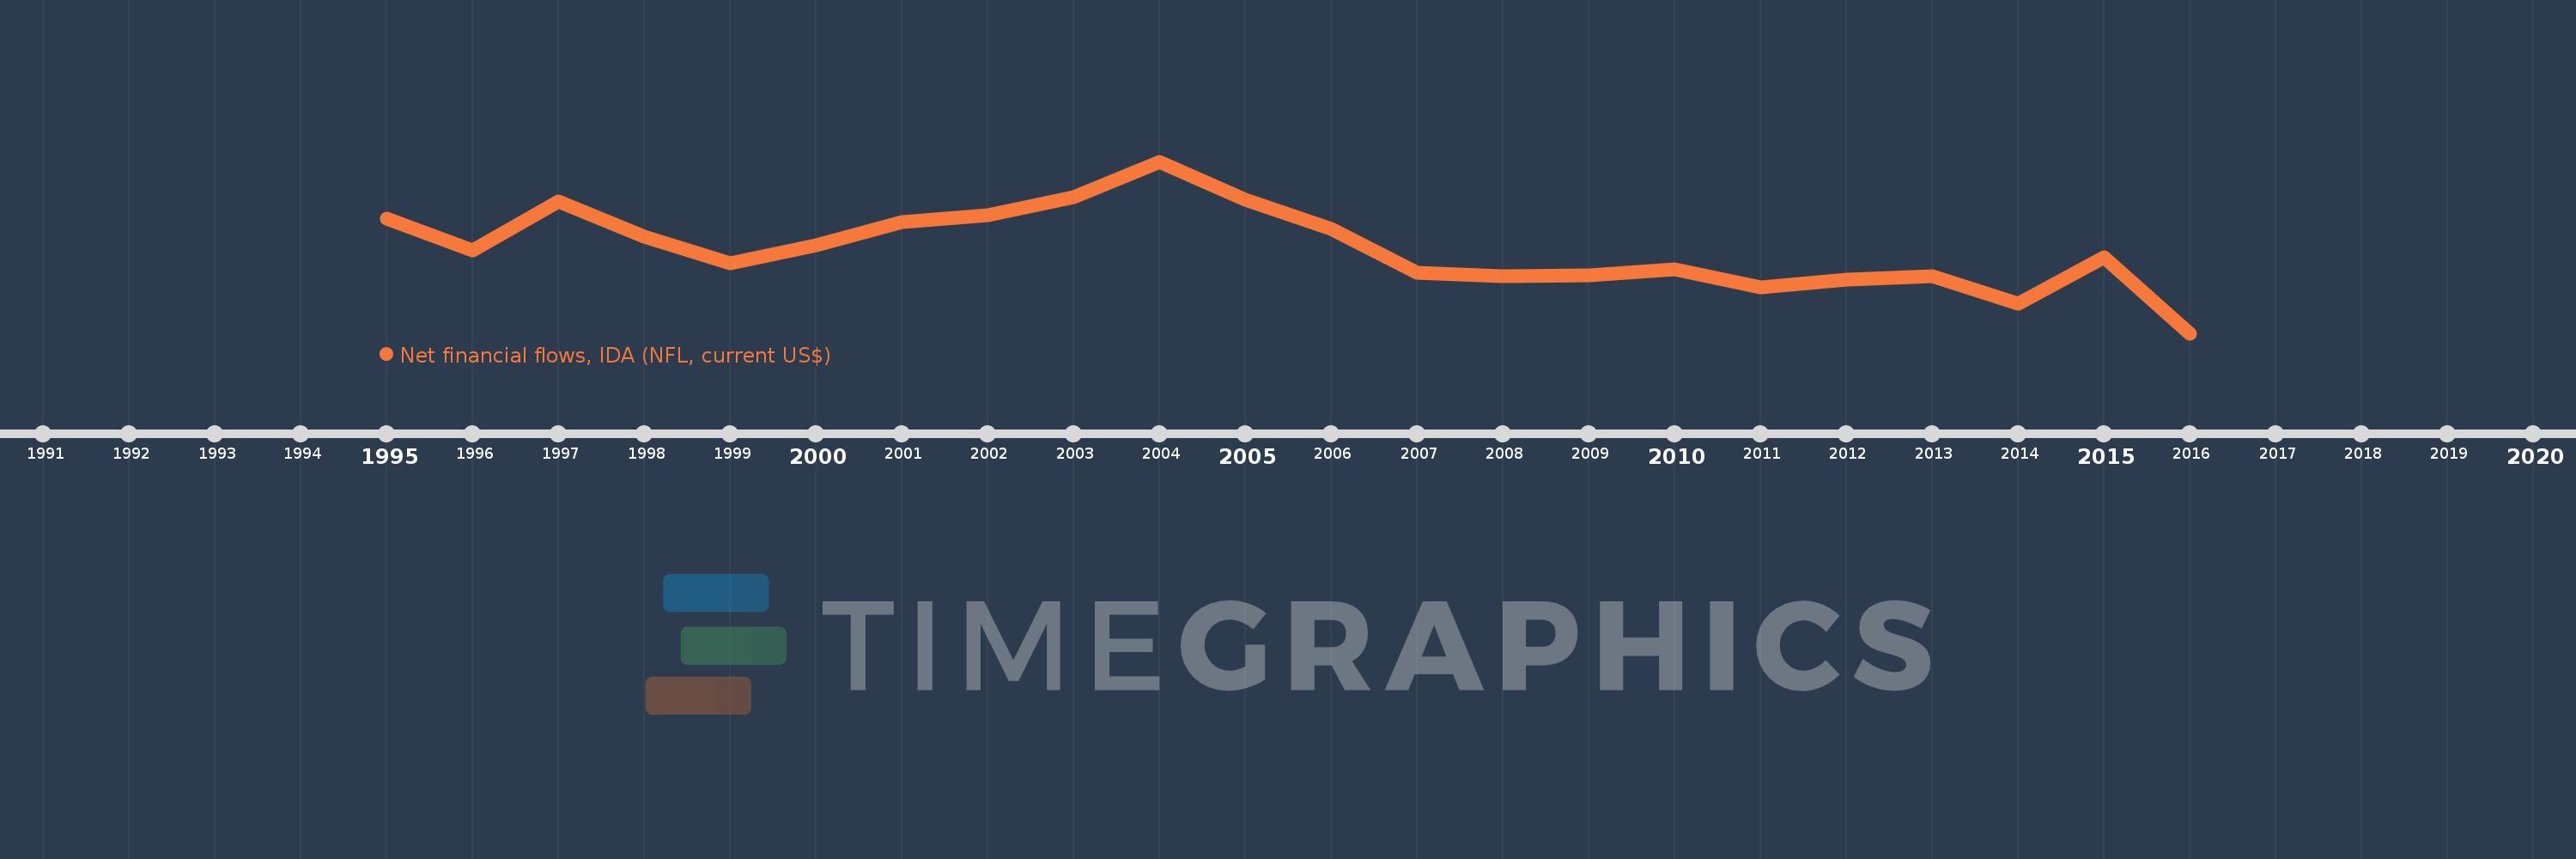
Questa scala temporale mostra un grafico dal 1995 anno al 2016 anno. Cambodia. I dati fino ad 1994 anno non disponibili. Il numero di osservazioni attuali secondo i date: 22.

La fonte (nome):

Indicatori dello sviluppo mondiale

La fonte (organizzazione):

World Bank, International Debt Statistics.

Categorie:

External Debt

sono stati aggiornati

23 apr 2017 anni

Indicatori delle variazioni dei valori per anni

In media:
25.347 Mln
Minima:
-10.806 Mln
1 gen 2016 anni
Massimo:
62.56 Mln
1 gen 2004 anni
Alla data di osservazione
Valore
Variazione assoluta
La variazione rispetto al valore precedente
1 gen 1995 anni
38.229 Mln
+38.229 Mln
0.0%
1 gen 1996 anni
24.623 Mln
-13.606 Mln
-35.59%
1 gen 1997 anni
45.622 Mln
+20.999 Mln
85.28%
1 gen 1998 anni
30.409 Mln
-15.213 Mln
-33.35%
1 gen 1999 anni
19.181 Mln
-11.228 Mln
-36.92%
1 gen 2000 anni
26.783 Mln
+7.602 Mln
39.63%
1 gen 2001 anni
36.569 Mln
+9.786 Mln
36.54%
1 gen 2002 anni
39.55 Mln
+2.981 Mln
8.15%
1 gen 2003 anni
47.246 Mln
+7.696 Mln
19.46%
1 gen 2004 anni
62.56 Mln
+15.314 Mln
32.41%
1 gen 2005 anni
46.321 Mln
-16.239 Mln
-25.96%
1 gen 2006 anni
33.665 Mln
-12.656 Mln
-27.32%
1 gen 2007 anni
15.078 Mln
-18.587 Mln
-55.21%
1 gen 2008 anni
13.649 Mln
-1.429 Mln
-9.48%
1 gen 2009 anni
14.085 Mln
+436.0 Mille.
3.19%
1 gen 2010 anni
16.383 Mln
+2.298 Mln
16.32%
1 gen 2011 anni
8.961 Mln
-7.422 Mln
-45.3%
1 gen 2012 anni
12.224 Mln
+3.263 Mln
36.41%
1 gen 2013 anni
13.623 Mln
+1.399 Mln
11.44%
1 gen 2014 anni
1.987 Mln
-11.636 Mln
-85.41%
1 gen 2015 anni
21.697 Mln
+19.71 Mln
991.95%
1 gen 2016 anni
-10.806 Mln
-32.503 Mln
-149.8%

Classificazione dei paesi secondo i statistiche attuali per anni