29
/it/
it
AIzaSyAYiBZKx7MnpbEhh9jyipgxe19OcubqV5w
April 1, 2024
237475
Serbia
SRB
true
2
1
Net financial flows, IDA (NFL, current US$)
2016,2015,2014,2013,2012,2011,2010,2009,2008,2007,2006,2005,2004,2003,2002
Download
Biblioteca di statistiche globali →Serbia →

Net financial flows, IDA (NFL, current US$)

Queste statistiche in altri paesi:
AfghanistanAlbaniaAngolaArmeniaAzerbaijanBangladeshBeninBhutanBoliviaBosnia and HerzegovinaBotswanaBurkina FasoBurundiCabo VerdeCambodiaCameroonCaribbean small statesCentral African RepublicCentral Europe and the BalticsChadChinaColombiaComorosCongo, Dem. Rep.Congo, Rep.Costa RicaCote d'IvoireCroatiaCzech RepublicDjiboutiDominicaDominican RepublicEarly-demographic dividendEast Asia & PacificEast Asia & Pacific (excluding high income)East Asia & Pacific (IDA & IBRD countries)EcuadorEgypt, Arab Rep.El SalvadorEquatorial GuineaEritreaEstoniaEthiopiaEurope & Central AsiaEurope & Central Asia (excluding high income)Europe & Central Asia (IDA & IBRD countries)Fragile and conflict affected situationsGambia, TheGeorgiaGhanaGreeceGrenadaGuineaGuinea-BissauGuyanaHaitiHondurasHungaryIBRD onlyIDA & IBRD totalIDA blendIDA onlyIDA totalIndiaIndonesiaJordanKenyaKorea, Rep.KosovoKyrgyz RepublicLao PDRLate-demographic dividendLatin America & Caribbean Latin America & Caribbean (excluding high income)Latin America & the Caribbean (IDA & IBRD countries)LesothoLiberiaLow & middle incomeLow incomeLower middle incomeMacedonia, FYRMadagascarMalawiMaldivesMaliMauritaniaMauritiusMiddle East & North AfricaMiddle East & North Africa (excluding high income)Middle East & North Africa (IDA & IBRD countries)Middle incomeMoldovaMongoliaMontenegroMoroccoMozambiqueMyanmarNepalNicaraguaNigerNigeriaOmanOther small statesPacific island small statesPakistanPapua New GuineaParaguayPhilippinesPolandPre-demographic dividendRwandaSamoaSao Tome and PrincipeSenegalSerbiaSeychellesSierra LeoneSlovak RepublicSloveniaSmall statesSolomon IslandsSomaliaSouth AsiaSouth Asia (IDA & IBRD)Sri LankaSt. Kitts and NevisSt. LuciaSt. Vincent and the GrenadinesSub-Saharan Africa Sub-Saharan Africa (excluding high income)Sub-Saharan Africa (IDA & IBRD countries)SudanSwazilandSyrian Arab RepublicTajikistanTanzaniaThailandTogoTongaTrinidad and TobagoTunisiaTurkeyUgandaUpper middle incomeUzbekistanVanuatuVietnamYemen, Rep.ZambiaZimbabwe
Linea del tempo:
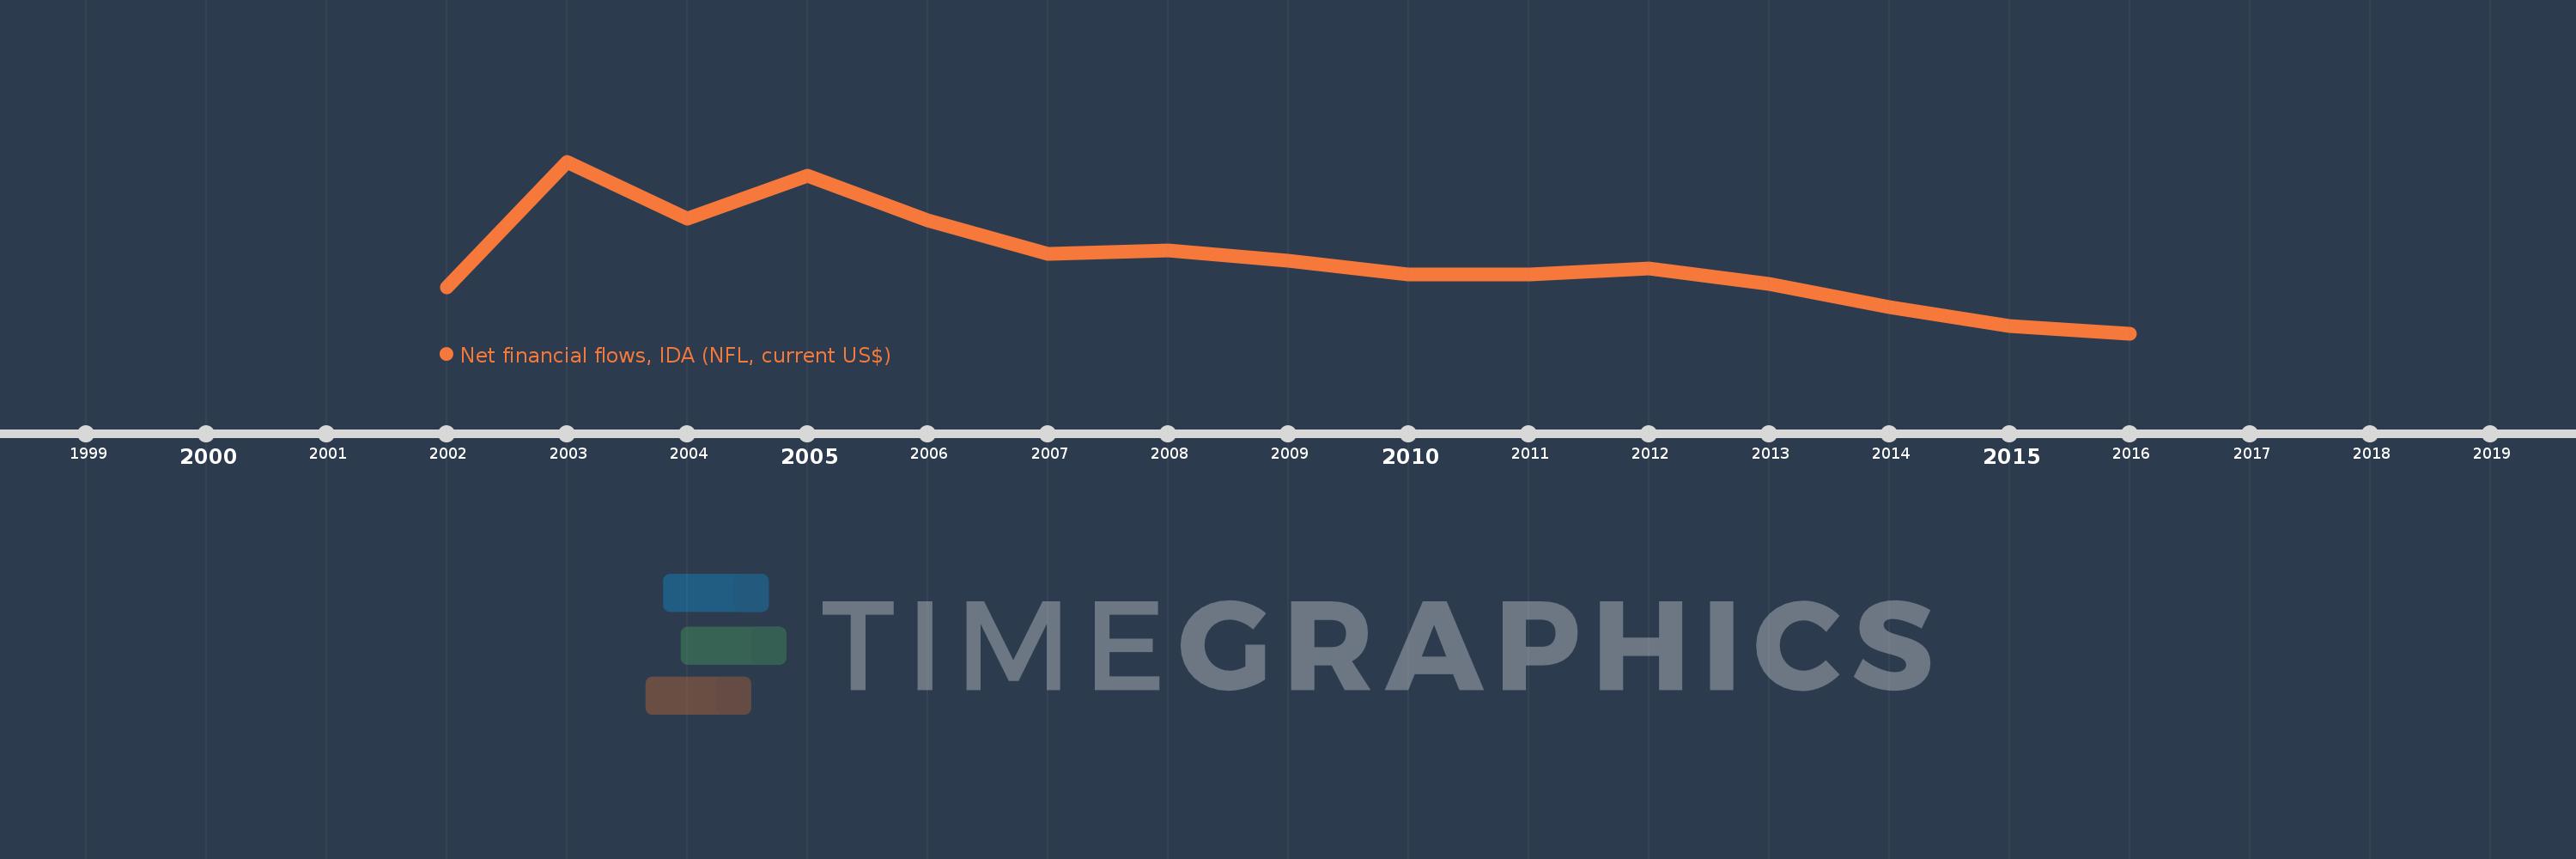
Questa scala temporale mostra un grafico dal 2002 anno al 2016 anno. Serbia. I dati fino ad 2001 anno non disponibili. Il numero di osservazioni attuali secondo i date: 15.
La fonte (nome):
Indicatori dello sviluppo mondiale
La fonte (organizzazione):
World Bank, International Debt Statistics.
Categorie:
External Debt
sono stati aggiornati
23 apr 2017 anni
Indicatori delle variazioni dei valori per anni
In media:
35.252 Mln
Minima:
-57.588 Mln
1 gen 2016 anni
Massimo:
159.391 Mln
1 gen 2003 anni
Alla data di osservazione
Valore
Variazione assoluta
La variazione rispetto al valore precedente
1 gen 2002 anni
0.0
0.0
0.0%
1 gen 2003 anni
159.391 Mln
+159.391 Mln
%
1 gen 2004 anni
86.942 Mln
-72.449 Mln
-45.45%
1 gen 2005 anni
141.765 Mln
+54.823 Mln
63.06%
1 gen 2006 anni
84.637 Mln
-57.128 Mln
-40.3%
1 gen 2007 anni
42.542 Mln
-42.095 Mln
-49.74%
1 gen 2008 anni
47.376 Mln
+4.834 Mln
11.36%
1 gen 2009 anni
34.482 Mln
-12.894 Mln
-27.22%
1 gen 2010 anni
16.603 Mln
-17.879 Mln
-51.85%
1 gen 2011 anni
16.401 Mln
-202.0 Mille.
-1.22%
1 gen 2012 anni
24.075 Mln
+7.674 Mln
46.79%
1 gen 2013 anni
5.146 Mln
-18.929 Mln
-78.63%
1 gen 2014 anni
-24.644 Mln
-29.79 Mln
-578.9%
1 gen 2015 anni
-48.345 Mln
-23.701 Mln
96.17%
1 gen 2016 anni
-57.588 Mln
-9.243 Mln
19.12%
Classificazione dei paesi secondo i statistiche attuali per anni

Commenti:

Inviare
PremiumAbout & FeedbackAccordoPrivatezza
logo
© 2022 Selected Technologies LLC – Morgan Hill, California