29
/it/
it
AIzaSyAYiBZKx7MnpbEhh9jyipgxe19OcubqV5w
April 1, 2024
65089
Albania
ALB
true
2
1
Net financial flows, IDA (NFL, current US$)
2016,2015,2014,2013,2012,2011,2010,2009,2008,2007,2006,2005,2004,2003,2002,2001,2000,1999,1998,1997,1996,1995,1994,1993
Download
Biblioteca di statistiche globali →Albania →

Net financial flows, IDA (NFL, current US$)

Queste statistiche in altri paesi:
AfghanistanAlbaniaAngolaArmeniaAzerbaijanBangladeshBeninBhutanBoliviaBosnia and HerzegovinaBotswanaBurkina FasoBurundiCabo VerdeCambodiaCameroonCaribbean small statesCentral African RepublicCentral Europe and the BalticsChadChinaColombiaComorosCongo, Dem. Rep.Congo, Rep.Costa RicaCote d'IvoireCroatiaCzech RepublicDjiboutiDominicaDominican RepublicEarly-demographic dividendEast Asia & PacificEast Asia & Pacific (excluding high income)East Asia & Pacific (IDA & IBRD countries)EcuadorEgypt, Arab Rep.El SalvadorEquatorial GuineaEritreaEstoniaEthiopiaEurope & Central AsiaEurope & Central Asia (excluding high income)Europe & Central Asia (IDA & IBRD countries)Fragile and conflict affected situationsGambia, TheGeorgiaGhanaGreeceGrenadaGuineaGuinea-BissauGuyanaHaitiHondurasHungaryIBRD onlyIDA & IBRD totalIDA blendIDA onlyIDA totalIndiaIndonesiaJordanKenyaKorea, Rep.KosovoKyrgyz RepublicLao PDRLate-demographic dividendLatin America & Caribbean Latin America & Caribbean (excluding high income)Latin America & the Caribbean (IDA & IBRD countries)LesothoLiberiaLow & middle incomeLow incomeLower middle incomeMacedonia, FYRMadagascarMalawiMaldivesMaliMauritaniaMauritiusMiddle East & North AfricaMiddle East & North Africa (excluding high income)Middle East & North Africa (IDA & IBRD countries)Middle incomeMoldovaMongoliaMontenegroMoroccoMozambiqueMyanmarNepalNicaraguaNigerNigeriaOmanOther small statesPacific island small statesPakistanPapua New GuineaParaguayPhilippinesPolandPre-demographic dividendRwandaSamoaSao Tome and PrincipeSenegalSerbiaSeychellesSierra LeoneSlovak RepublicSloveniaSmall statesSolomon IslandsSomaliaSouth AsiaSouth Asia (IDA & IBRD)Sri LankaSt. Kitts and NevisSt. LuciaSt. Vincent and the GrenadinesSub-Saharan Africa Sub-Saharan Africa (excluding high income)Sub-Saharan Africa (IDA & IBRD countries)SudanSwazilandSyrian Arab RepublicTajikistanTanzaniaThailandTogoTongaTrinidad and TobagoTunisiaTurkeyUgandaUpper middle incomeUzbekistanVanuatuVietnamYemen, Rep.ZambiaZimbabwe
Linea del tempo:
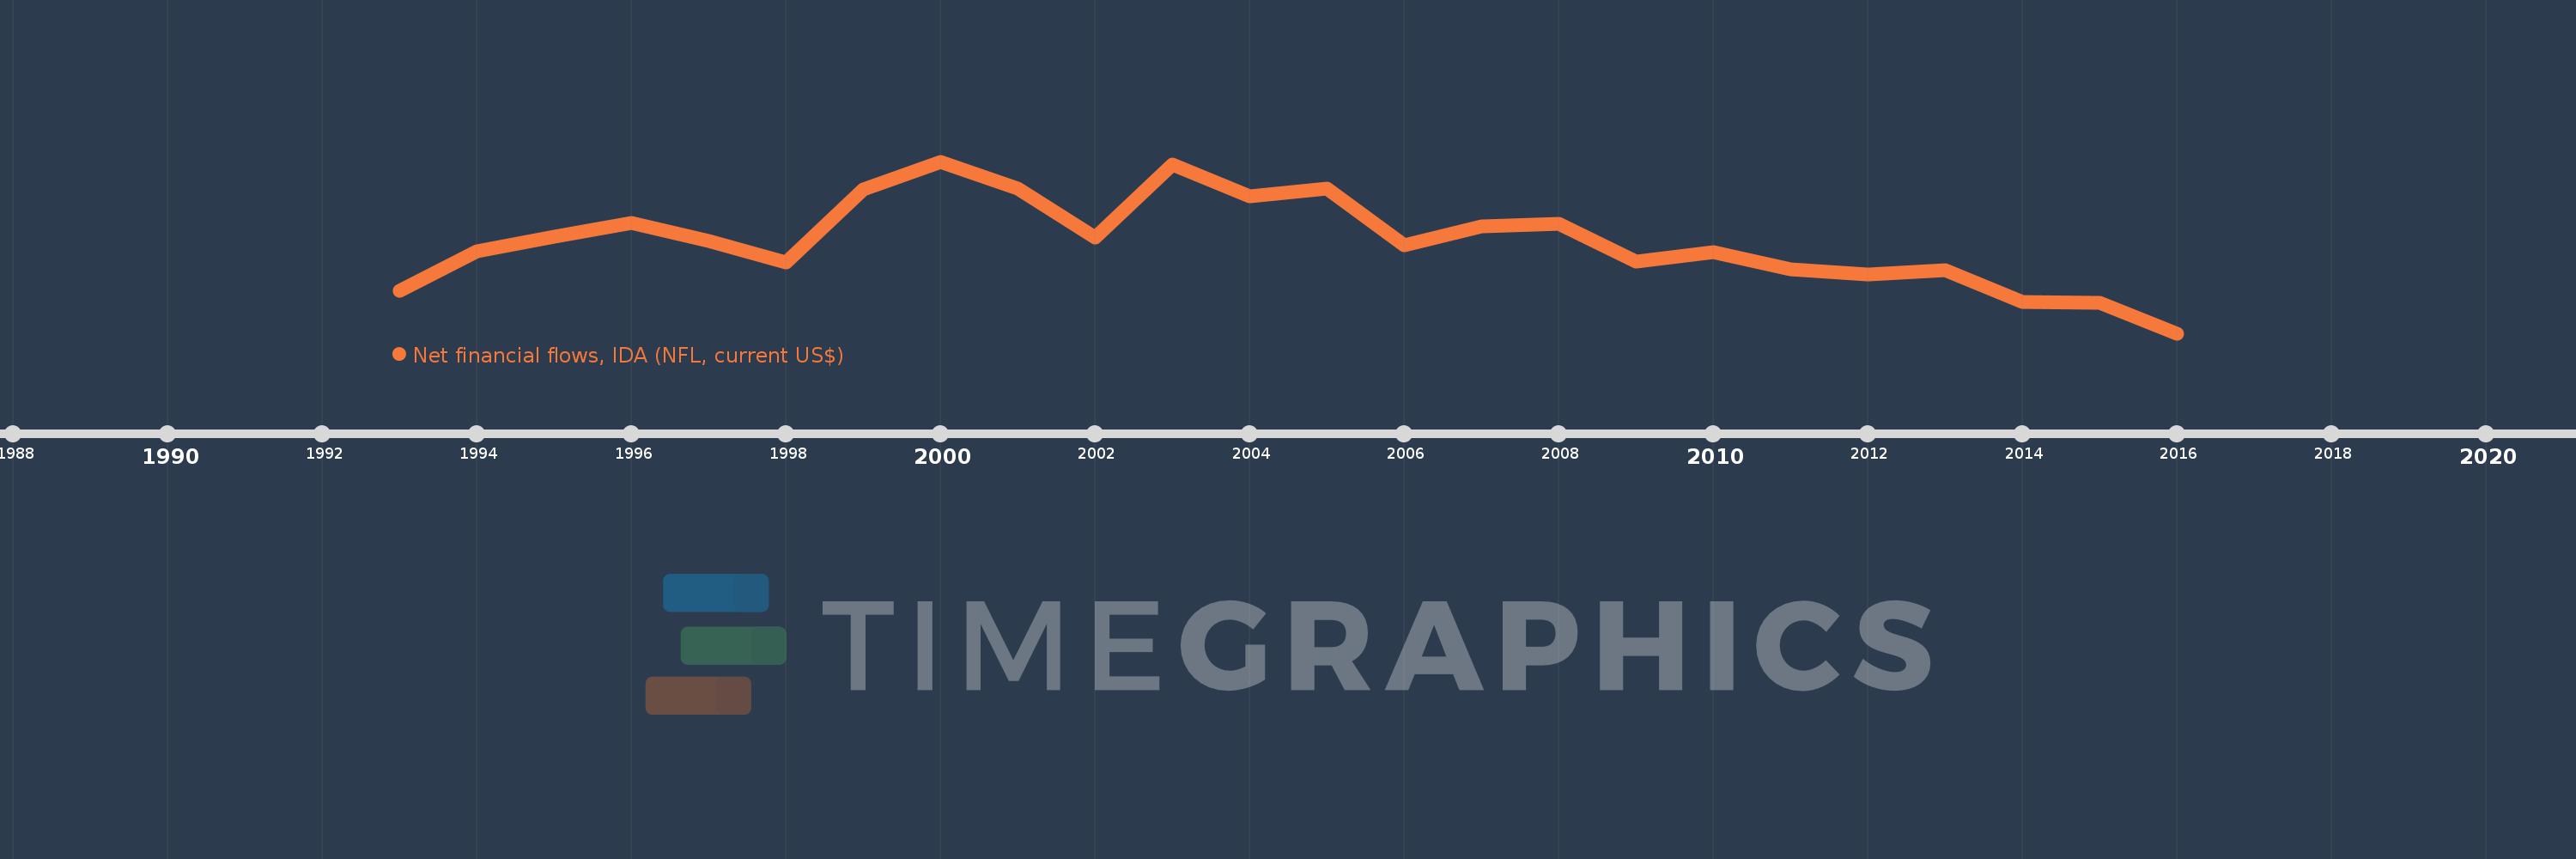
Questa scala temporale mostra un grafico dal 1993 anno al 2016 anno. Albania. I dati fino ad 1992 anno non disponibili. Il numero di osservazioni attuali secondo i date: 24.
La fonte (nome):
Indicatori dello sviluppo mondiale
La fonte (organizzazione):
World Bank, International Debt Statistics.
Categorie:
External Debt
sono stati aggiornati
23 apr 2017 anni
Indicatori delle variazioni dei valori per anni
In media:
32.04 Mln
Minima:
-24.0 Mln
1 gen 2016 anni
Massimo:
80.644 Mln
1 gen 2000 anni
Alla data di osservazione
Valore
Variazione assoluta
La variazione rispetto al valore precedente
1 gen 1993 anni
2.065 Mln
+2.065 Mln
0.0%
1 gen 1994 anni
25.841 Mln
+23.776 Mln
1.15 Mille.%
1 gen 1995 anni
34.989 Mln
+9.148 Mln
35.4%
1 gen 1996 anni
43.335 Mln
+8.346 Mln
23.85%
1 gen 1997 anni
32.324 Mln
-11.011 Mln
-25.41%
1 gen 1998 anni
18.912 Mln
-13.412 Mln
-41.49%
1 gen 1999 anni
63.727 Mln
+44.815 Mln
236.97%
1 gen 2000 anni
80.644 Mln
+16.917 Mln
26.55%
1 gen 2001 anni
64.357 Mln
-16.287 Mln
-20.2%
1 gen 2002 anni
34.26 Mln
-30.097 Mln
-46.77%
1 gen 2003 anni
78.883 Mln
+44.623 Mln
130.25%
1 gen 2004 anni
59.447 Mln
-19.436 Mln
-24.64%
1 gen 2005 anni
64.294 Mln
+4.847 Mln
8.15%
1 gen 2006 anni
29.57 Mln
-34.724 Mln
-54.01%
1 gen 2007 anni
40.88 Mln
+11.31 Mln
38.25%
1 gen 2008 anni
42.902 Mln
+2.022 Mln
4.95%
1 gen 2009 anni
19.932 Mln
-22.97 Mln
-53.54%
1 gen 2010 anni
25.548 Mln
+5.616 Mln
28.18%
1 gen 2011 anni
15.124 Mln
-10.424 Mln
-40.8%
1 gen 2012 anni
12.052 Mln
-3.072 Mln
-20.31%
1 gen 2013 anni
14.198 Mln
+2.146 Mln
17.81%
1 gen 2014 anni
-4.685 Mln
-18.883 Mln
-133.0%
1 gen 2015 anni
-5.628 Mln
-943.0 Mille.
20.13%
1 gen 2016 anni
-24.0 Mln
-18.372 Mln
326.44%
Classificazione dei paesi secondo i statistiche attuali per anni

Commenti:

Inviare
PremiumAbout & FeedbackAccordoPrivatezza
logo
© 2022 Selected Technologies LLC – Morgan Hill, California