33
/it/
AIzaSyAYiBZKx7MnpbEhh9jyipgxe19OcubqV5w
August 1, 2025
197928
Moldova
MDA
true
2
1
Net financial flows, IDA (NFL, current US$)
2016,2015,2014,2013,2012,2011,2010,2009,2008,2007,2006,2005,2004,2003,2002,2001,2000,1999,1998
Download
Biblioteca di statistiche globali →Moldova →

Net financial flows, IDA (NFL, current US$)

Queste statistiche in altri paesi:

AfghanistanAlbaniaAngolaArmeniaAzerbaijanBangladeshBeninBhutanBoliviaBosnia and HerzegovinaBotswanaBurkina FasoBurundiCabo VerdeCambodiaCameroonCaribbean small statesCentral African RepublicCentral Europe and the BalticsChadChinaColombiaComorosCongo, Dem. Rep.Congo, Rep.Costa RicaCote d'IvoireCroatiaCzech RepublicDjiboutiDominicaDominican RepublicEarly-demographic dividendEast Asia & PacificEast Asia & Pacific (excluding high income)East Asia & Pacific (IDA & IBRD countries)EcuadorEgypt, Arab Rep.El SalvadorEquatorial GuineaEritreaEstoniaEthiopiaEurope & Central AsiaEurope & Central Asia (excluding high income)Europe & Central Asia (IDA & IBRD countries)Fragile and conflict affected situationsGambia, TheGeorgiaGhanaGreeceGrenadaGuineaGuinea-BissauGuyanaHaitiHondurasHungaryIBRD onlyIDA & IBRD totalIDA blendIDA onlyIDA totalIndiaIndonesiaJordanKenyaKorea, Rep.KosovoKyrgyz RepublicLao PDRLate-demographic dividendLatin America & Caribbean Latin America & Caribbean (excluding high income)Latin America & the Caribbean (IDA & IBRD countries)LesothoLiberiaLow & middle incomeLow incomeLower middle incomeMacedonia, FYRMadagascarMalawiMaldivesMaliMauritaniaMauritiusMiddle East & North AfricaMiddle East & North Africa (excluding high income)Middle East & North Africa (IDA & IBRD countries)Middle incomeMoldovaMongoliaMontenegroMoroccoMozambiqueMyanmarNepalNicaraguaNigerNigeriaOmanOther small statesPacific island small statesPakistanPapua New GuineaParaguayPhilippinesPolandPre-demographic dividendRwandaSamoaSao Tome and PrincipeSenegalSerbiaSeychellesSierra LeoneSlovak RepublicSloveniaSmall statesSolomon IslandsSomaliaSouth AsiaSouth Asia (IDA & IBRD)Sri LankaSt. Kitts and NevisSt. LuciaSt. Vincent and the GrenadinesSub-Saharan Africa Sub-Saharan Africa (excluding high income)Sub-Saharan Africa (IDA & IBRD countries)SudanSwazilandSyrian Arab RepublicTajikistanTanzaniaThailandTogoTongaTrinidad and TobagoTunisiaTurkeyUgandaUpper middle incomeUzbekistanVanuatuVietnamYemen, Rep.ZambiaZimbabwe

Linea del tempo:

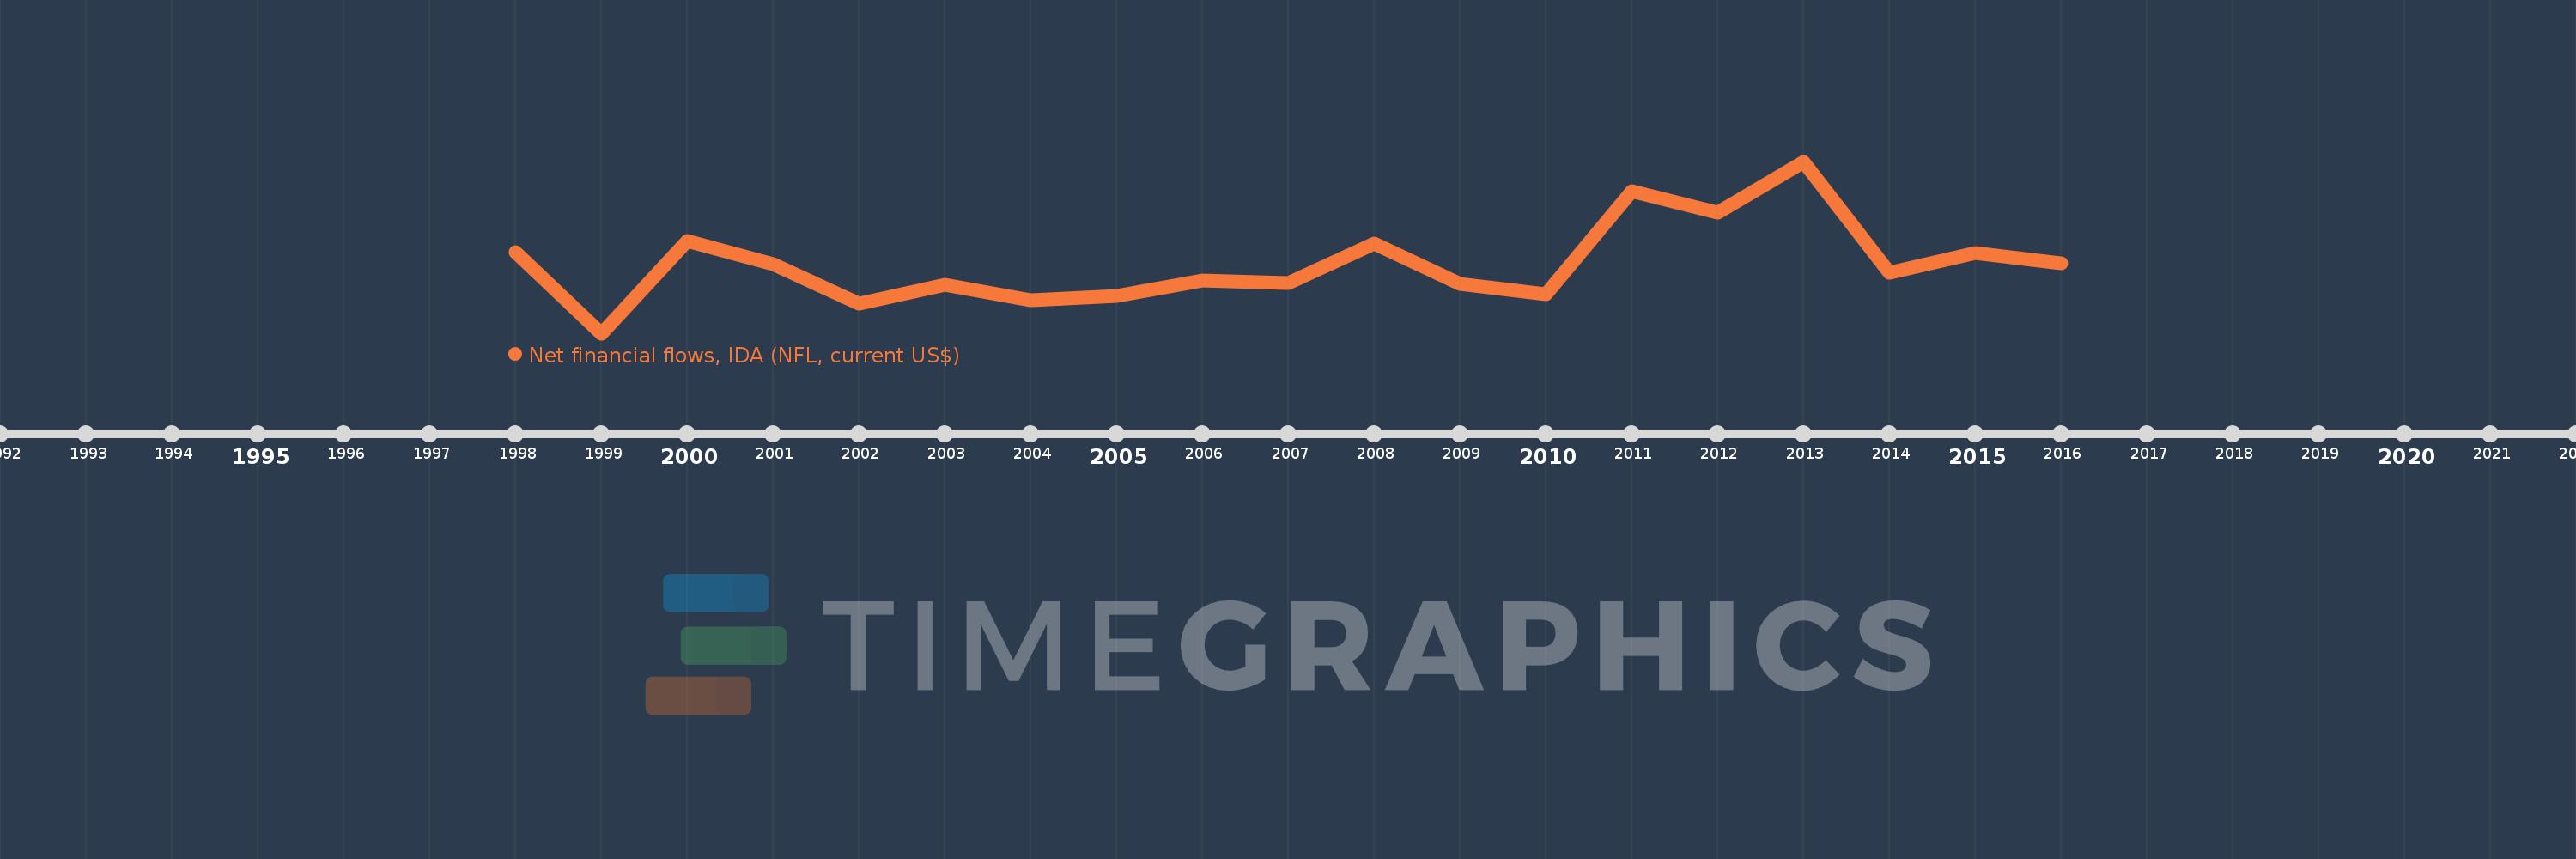
Questa scala temporale mostra un grafico dal 1998 anno al 2016 anno. Moldova. I dati fino ad 1997 anno non disponibili. Il numero di osservazioni attuali secondo i date: 19.

La fonte (nome):

Indicatori dello sviluppo mondiale

La fonte (organizzazione):

World Bank, International Debt Statistics.

Categorie:

External Debt

sono stati aggiornati

23 apr 2017 anni

Indicatori delle variazioni dei valori per anni

In media:
30.145 Mln
Minima:
2.258 Mln
1 gen 1999 anni
Massimo:
71.252 Mln
1 gen 2013 anni
Alla data di osservazione
Valore
Variazione assoluta
La variazione rispetto al valore precedente
1 gen 1998 anni
35.0 Mln
+35.0 Mln
0.0%
1 gen 1999 anni
2.258 Mln
-32.742 Mln
-93.55%
1 gen 2000 anni
39.27 Mln
+37.012 Mln
1.64 Mille.%
1 gen 2001 anni
30.083 Mln
-9.187 Mln
-23.39%
1 gen 2002 anni
14.156 Mln
-15.927 Mln
-52.94%
1 gen 2003 anni
21.87 Mln
+7.714 Mln
54.49%
1 gen 2004 anni
15.654 Mln
-6.216 Mln
-28.42%
1 gen 2005 anni
17.237 Mln
+1.583 Mln
10.11%
1 gen 2006 anni
23.563 Mln
+6.326 Mln
36.7%
1 gen 2007 anni
22.568 Mln
-995.0 Mille.
-4.22%
1 gen 2008 anni
38.153 Mln
+15.585 Mln
69.06%
1 gen 2009 anni
22.19 Mln
-15.963 Mln
-41.84%
1 gen 2010 anni
17.985 Mln
-4.205 Mln
-18.95%
1 gen 2011 anni
59.366 Mln
+41.381 Mln
230.09%
1 gen 2012 anni
50.718 Mln
-8.648 Mln
-14.57%
1 gen 2013 anni
71.252 Mln
+20.534 Mln
40.49%
1 gen 2014 anni
26.661 Mln
-44.591 Mln
-62.58%
1 gen 2015 anni
34.56 Mln
+7.899 Mln
29.63%
1 gen 2016 anni
30.215 Mln
-4.345 Mln
-12.57%

Classificazione dei paesi secondo i statistiche attuali per anni