30
/it/
AIzaSyAYiBZKx7MnpbEhh9jyipgxe19OcubqV5w
April 1, 2024
200720
Montenegro
MNE
true
2
1
Net financial flows, IDA (NFL, current US$)
2016,2015,2014,2013,2012,2011,2010,2009,2008,2007
Download
Biblioteca di statistiche globali →Montenegro →

Net financial flows, IDA (NFL, current US$)

Queste statistiche in altri paesi:

AfghanistanAlbaniaAngolaArmeniaAzerbaijanBangladeshBeninBhutanBoliviaBosnia and HerzegovinaBotswanaBurkina FasoBurundiCabo VerdeCambodiaCameroonCaribbean small statesCentral African RepublicCentral Europe and the BalticsChadChinaColombiaComorosCongo, Dem. Rep.Congo, Rep.Costa RicaCote d'IvoireCroatiaCzech RepublicDjiboutiDominicaDominican RepublicEarly-demographic dividendEast Asia & PacificEast Asia & Pacific (excluding high income)East Asia & Pacific (IDA & IBRD countries)EcuadorEgypt, Arab Rep.El SalvadorEquatorial GuineaEritreaEstoniaEthiopiaEurope & Central AsiaEurope & Central Asia (excluding high income)Europe & Central Asia (IDA & IBRD countries)Fragile and conflict affected situationsGambia, TheGeorgiaGhanaGreeceGrenadaGuineaGuinea-BissauGuyanaHaitiHondurasHungaryIBRD onlyIDA & IBRD totalIDA blendIDA onlyIDA totalIndiaIndonesiaJordanKenyaKorea, Rep.KosovoKyrgyz RepublicLao PDRLate-demographic dividendLatin America & Caribbean Latin America & Caribbean (excluding high income)Latin America & the Caribbean (IDA & IBRD countries)LesothoLiberiaLow & middle incomeLow incomeLower middle incomeMacedonia, FYRMadagascarMalawiMaldivesMaliMauritaniaMauritiusMiddle East & North AfricaMiddle East & North Africa (excluding high income)Middle East & North Africa (IDA & IBRD countries)Middle incomeMoldovaMongoliaMontenegroMoroccoMozambiqueMyanmarNepalNicaraguaNigerNigeriaOmanOther small statesPacific island small statesPakistanPapua New GuineaParaguayPhilippinesPolandPre-demographic dividendRwandaSamoaSao Tome and PrincipeSenegalSerbiaSeychellesSierra LeoneSlovak RepublicSloveniaSmall statesSolomon IslandsSomaliaSouth AsiaSouth Asia (IDA & IBRD)Sri LankaSt. Kitts and NevisSt. LuciaSt. Vincent and the GrenadinesSub-Saharan Africa Sub-Saharan Africa (excluding high income)Sub-Saharan Africa (IDA & IBRD countries)SudanSwazilandSyrian Arab RepublicTajikistanTanzaniaThailandTogoTongaTrinidad and TobagoTunisiaTurkeyUgandaUpper middle incomeUzbekistanVanuatuVietnamYemen, Rep.ZambiaZimbabwe

Linea del tempo:

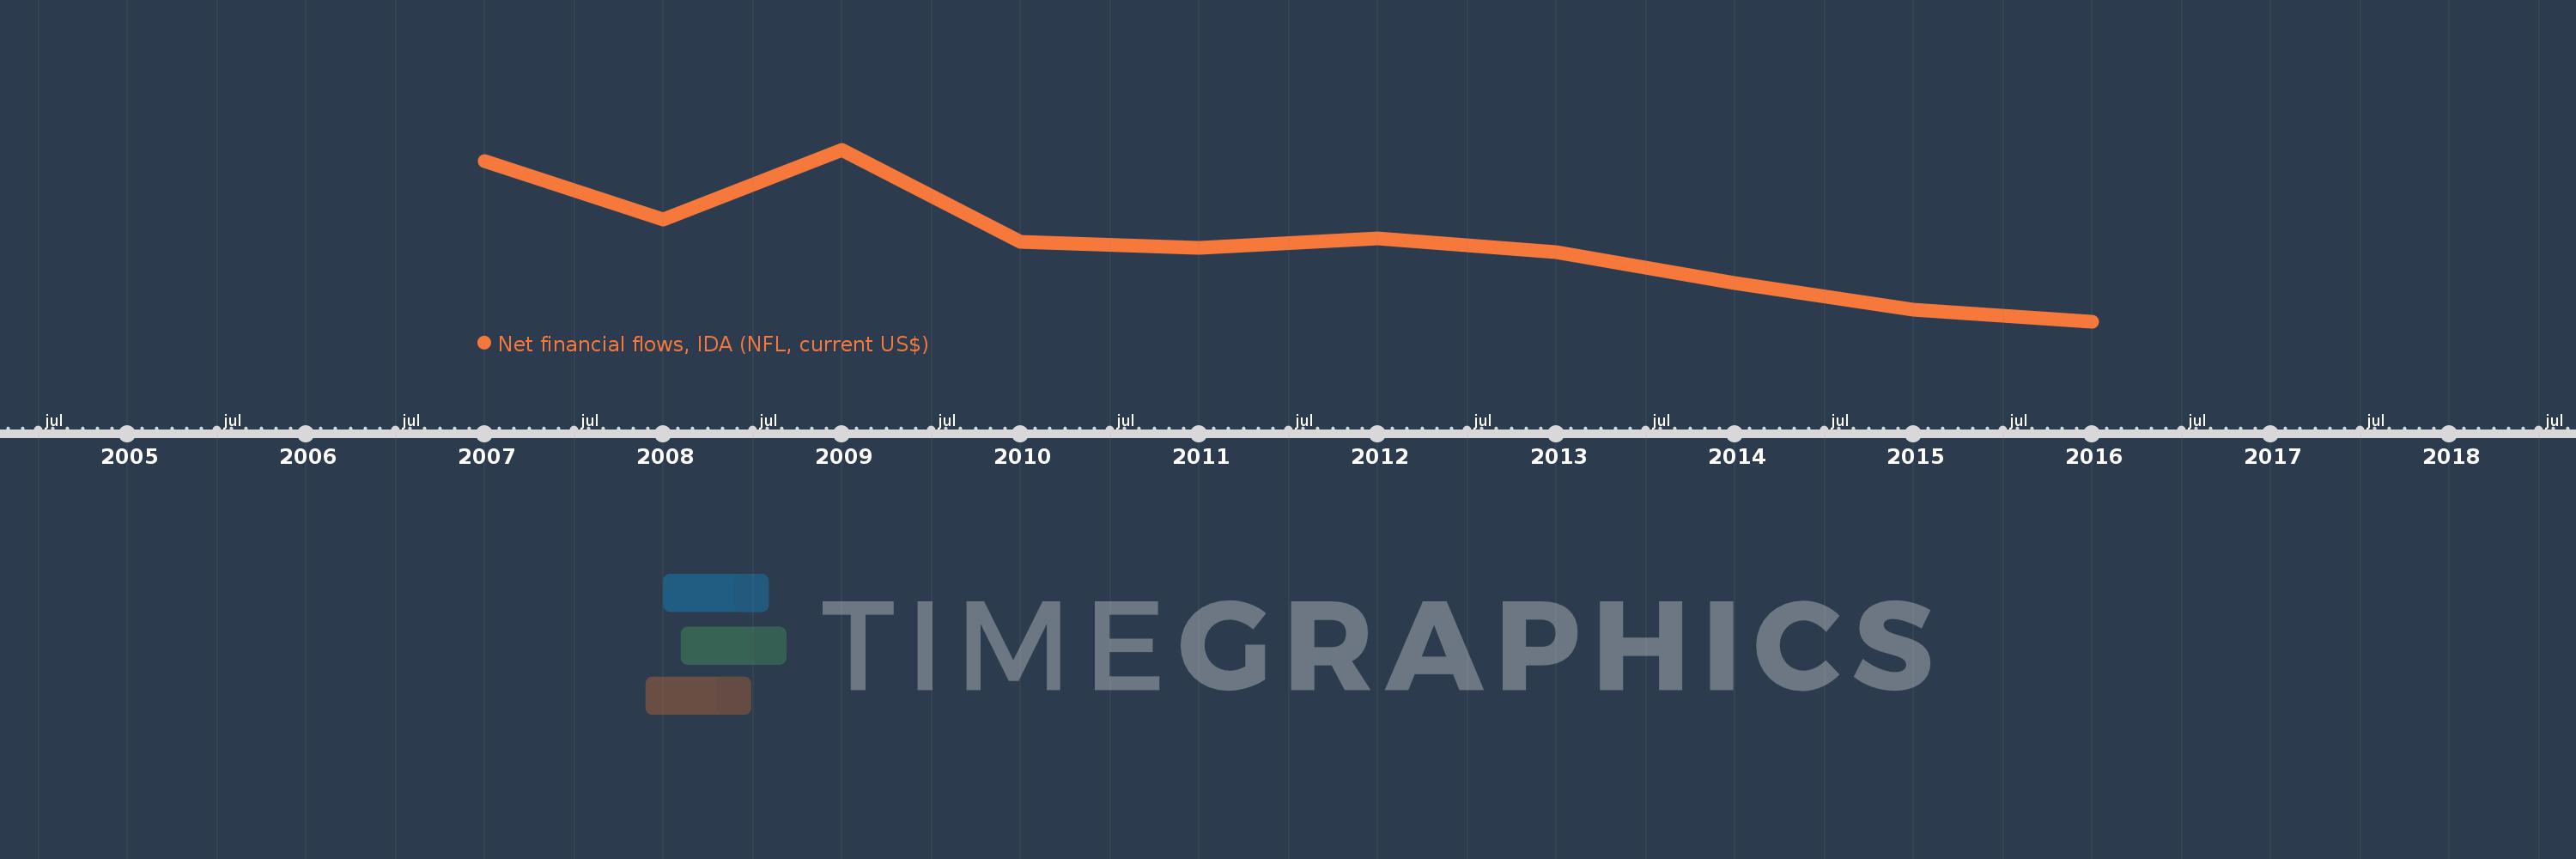
Questa scala temporale mostra un grafico dal 2007 anno al 2016 anno. Montenegro. I dati fino ad 2006 anno non disponibili. Il numero di osservazioni attuali secondo i date: 10.

La fonte (nome):

Indicatori dello sviluppo mondiale

La fonte (organizzazione):

World Bank, International Debt Statistics.

Categorie:

External Debt

sono stati aggiornati

23 apr 2017 anni

Indicatori delle variazioni dei valori per anni

In media:
3.683 Mln
Minima:
-6.398 Mln
1 gen 2016 anni
Massimo:
15.418 Mln
1 gen 2009 anni
Alla data di osservazione
Valore
Variazione assoluta
La variazione rispetto al valore precedente
1 gen 2007 anni
14.006 Mln
+14.006 Mln
0.0%
1 gen 2008 anni
6.6 Mln
-7.406 Mln
-52.88%
1 gen 2009 anni
15.418 Mln
+8.818 Mln
133.61%
1 gen 2010 anni
3.796 Mln
-11.622 Mln
-75.38%
1 gen 2011 anni
3.032 Mln
-764.0 Mille.
-20.13%
1 gen 2012 anni
4.241 Mln
+1.209 Mln
39.87%
1 gen 2013 anni
2.51 Mln
-1.731 Mln
-40.82%
1 gen 2014 anni
-1.509 Mln
-4.019 Mln
-160.12%
1 gen 2015 anni
-4.867 Mln
-3.358 Mln
222.53%
1 gen 2016 anni
-6.398 Mln
-1.531 Mln
31.46%

Classificazione dei paesi secondo i statistiche attuali per anni