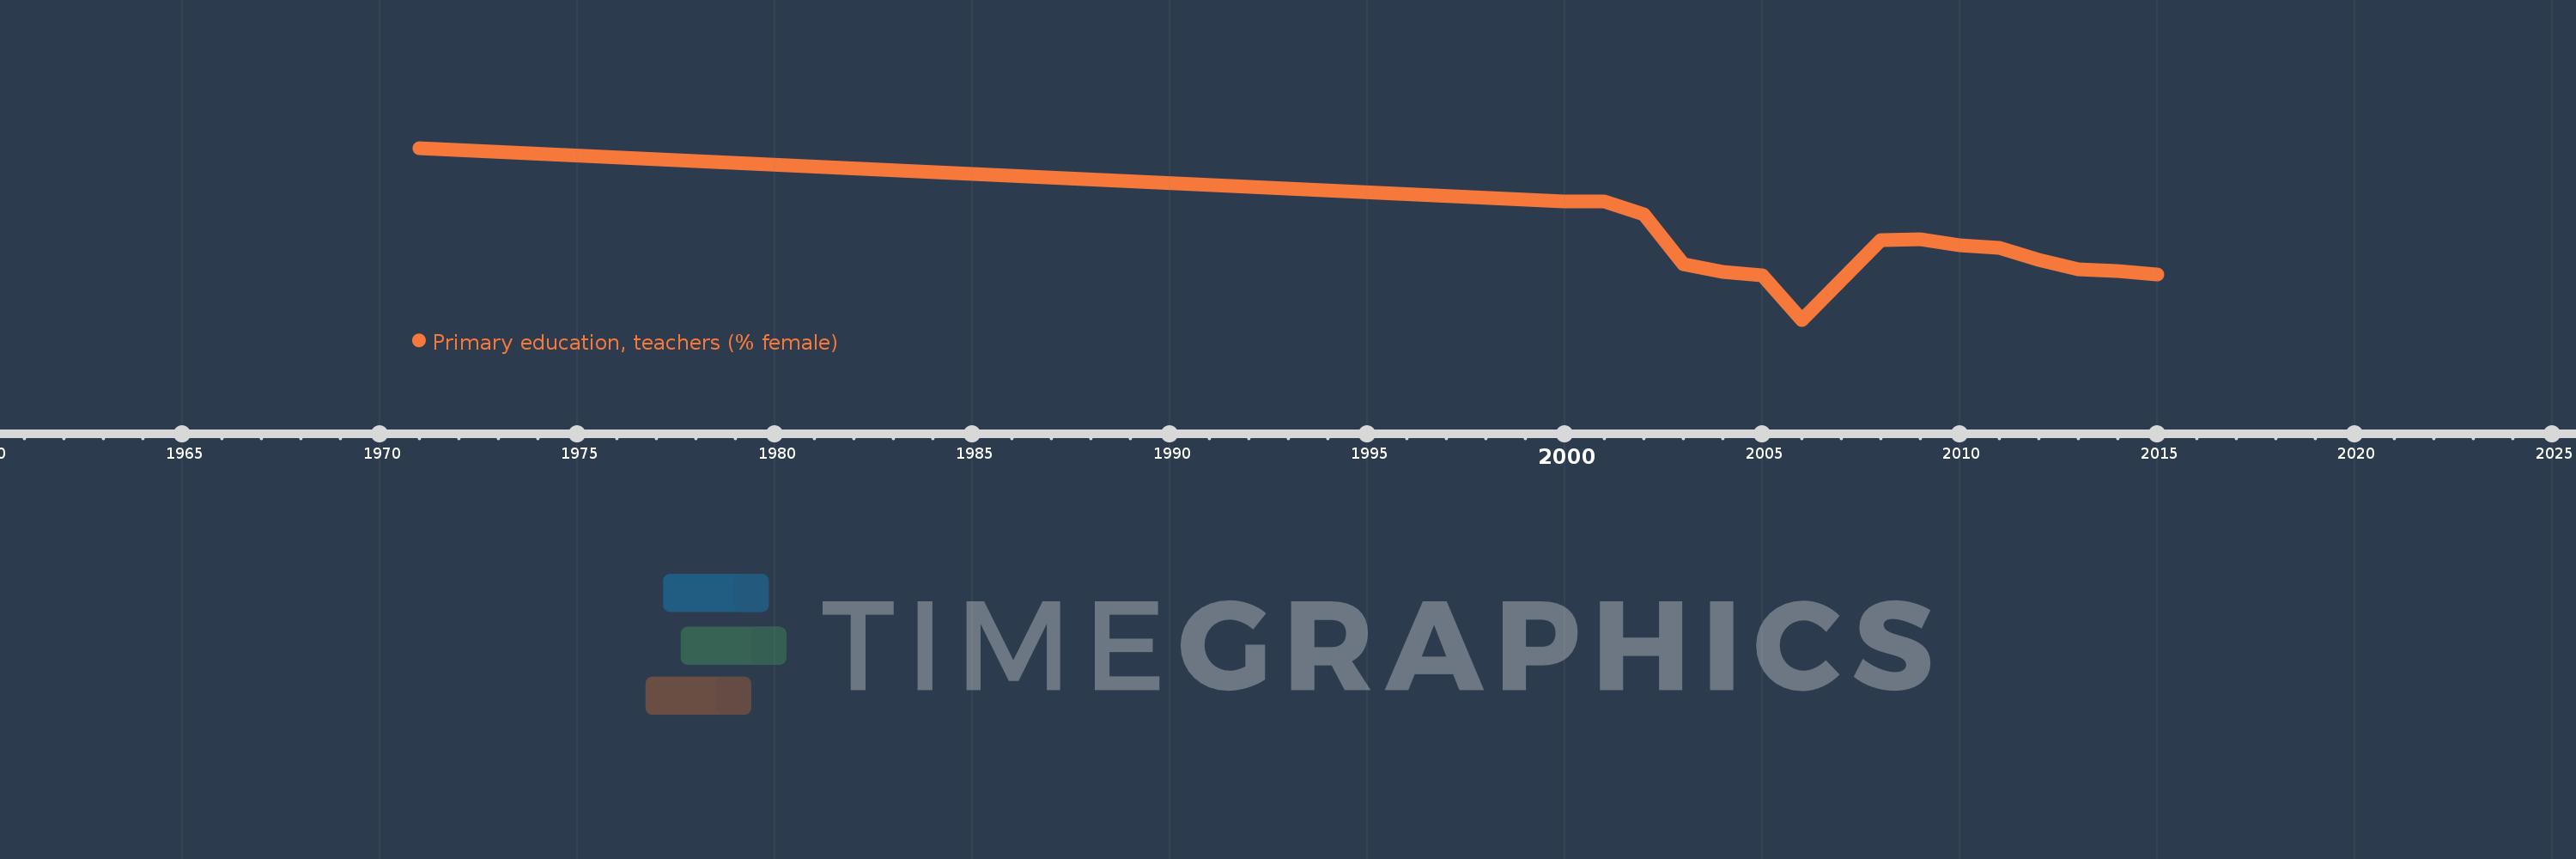
Questa scala temporale mostra un grafico dal 1971 anno al 2015 anno. Brazil. I dati fino ad 1970 anno non disponibili. Il numero di osservazioni attuali secondo i date: 16.
La fonte (nome):
Indicatori dello sviluppo mondiale
La fonte (organizzazione):
United Nations Educational, Scientific, and Cultural Organization (UNESCO) Institute for Statistics.
Categorie:
Education, Gender
sono stati aggiornati
23 apr 2017 anni
Indicatori delle variazioni dei valori per anni
In media:
90.773
Minima:
87.787
1 gen 2006 anni
Massimo:
94.783
1 gen 1971 anni
Alla data di osservazione
Valore
Variazione assoluta
La variazione rispetto al valore precedente
1 gen 1971 anni
94.783
+94.783
0.0%
1 gen 2000 anni
92.614
-2.169
-2.29%
1 gen 2001 anni
92.613
-0.001
0.0%
1 gen 2002 anni
92.072
-0.541
-0.58%
1 gen 2003 anni
90.045
-2.028
-2.2%
1 gen 2004 anni
89.735
-0.31
-0.34%
1 gen 2005 anni
89.578
-0.156
-0.17%
1 gen 2006 anni
87.787
-1.791
-2.0%
1 gen 2008 anni
91.03
+3.242
3.69%
1 gen 2009 anni
91.076
+0.046
0.05%
1 gen 2010 anni
90.833
-0.242
-0.27%
1 gen 2011 anni
90.731
-0.102
-0.11%
1 gen 2012 anni
90.233
-0.498
-0.55%
1 gen 2013 anni
89.83
-0.404
-0.45%
1 gen 2014 anni
89.769
-0.061
-0.07%
1 gen 2015 anni
89.635
-0.133
-0.15%
Classificazione dei paesi secondo i statistiche attuali per anni