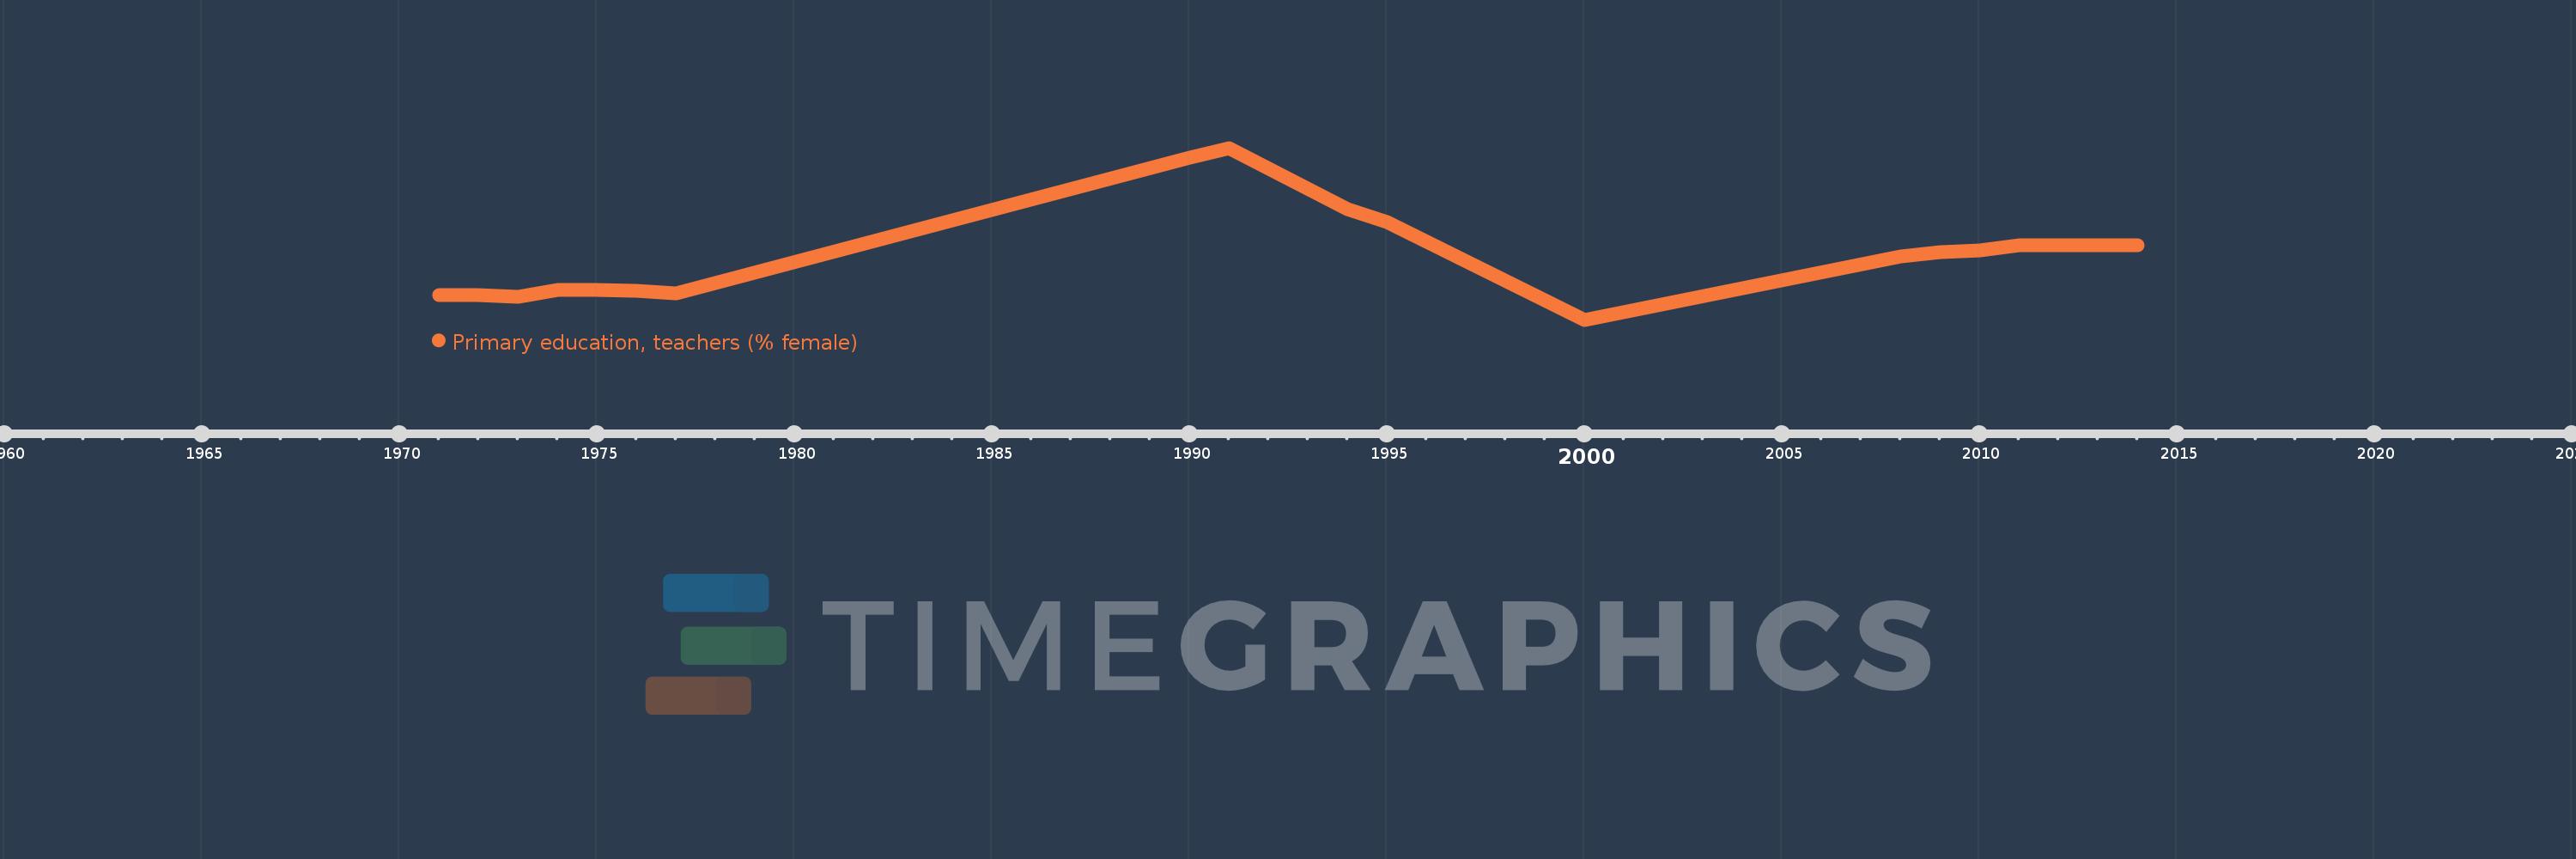
Questa scala temporale mostra un grafico dal 1971 anno al 2014 anno. Afghanistan. I dati fino ad 1970 anno non disponibili. Il numero di osservazioni attuali secondo i date: 19.
La fonte (nome):
Indicatori dello sviluppo mondiale
La fonte (organizzazione):
United Nations Educational, Scientific, and Cultural Organization (UNESCO) Institute for Statistics.
Categorie:
Education, Gender
sono stati aggiornati
23 apr 2017 anni
Indicatori delle variazioni dei valori per anni
In media:
28.159
Minima:
9.721
1 gen 2000 anni
Massimo:
58.745
1 gen 1991 anni
Alla data di osservazione
Valore
Variazione assoluta
La variazione rispetto al valore precedente
1 gen 1971 anni
16.644
+16.644
0.0%
1 gen 1972 anni
16.784
+0.14
0.84%
1 gen 1973 anni
16.302
-0.482
-2.87%
1 gen 1974 anni
18.315
+2.013
12.35%
1 gen 1975 anni
18.289
-0.026
-0.14%
1 gen 1976 anni
18.068
-0.221
-1.21%
1 gen 1977 anni
17.127
-0.94
-5.2%
1 gen 1990 anni
55.966
+38.839
226.76%
1 gen 1991 anni
58.745
+2.779
4.97%
1 gen 1994 anni
41.225
-17.52
-29.82%
1 gen 1995 anni
37.681
-3.544
-8.6%
1 gen 2000 anni
9.721
-27.96
-74.2%
1 gen 2008 anni
27.691
+17.969
184.84%
1 gen 2009 anni
29.0
+1.309
4.73%
1 gen 2010 anni
29.47
+0.47
1.62%
1 gen 2011 anni
31.0
+1.53
5.19%
1 gen 2012 anni
31.0
+0.0
0.0%
1 gen 2013 anni
31.0
0.0
0.0%
1 gen 2014 anni
31.0
+0.0
0.0%
Classificazione dei paesi secondo i statistiche attuali per anni