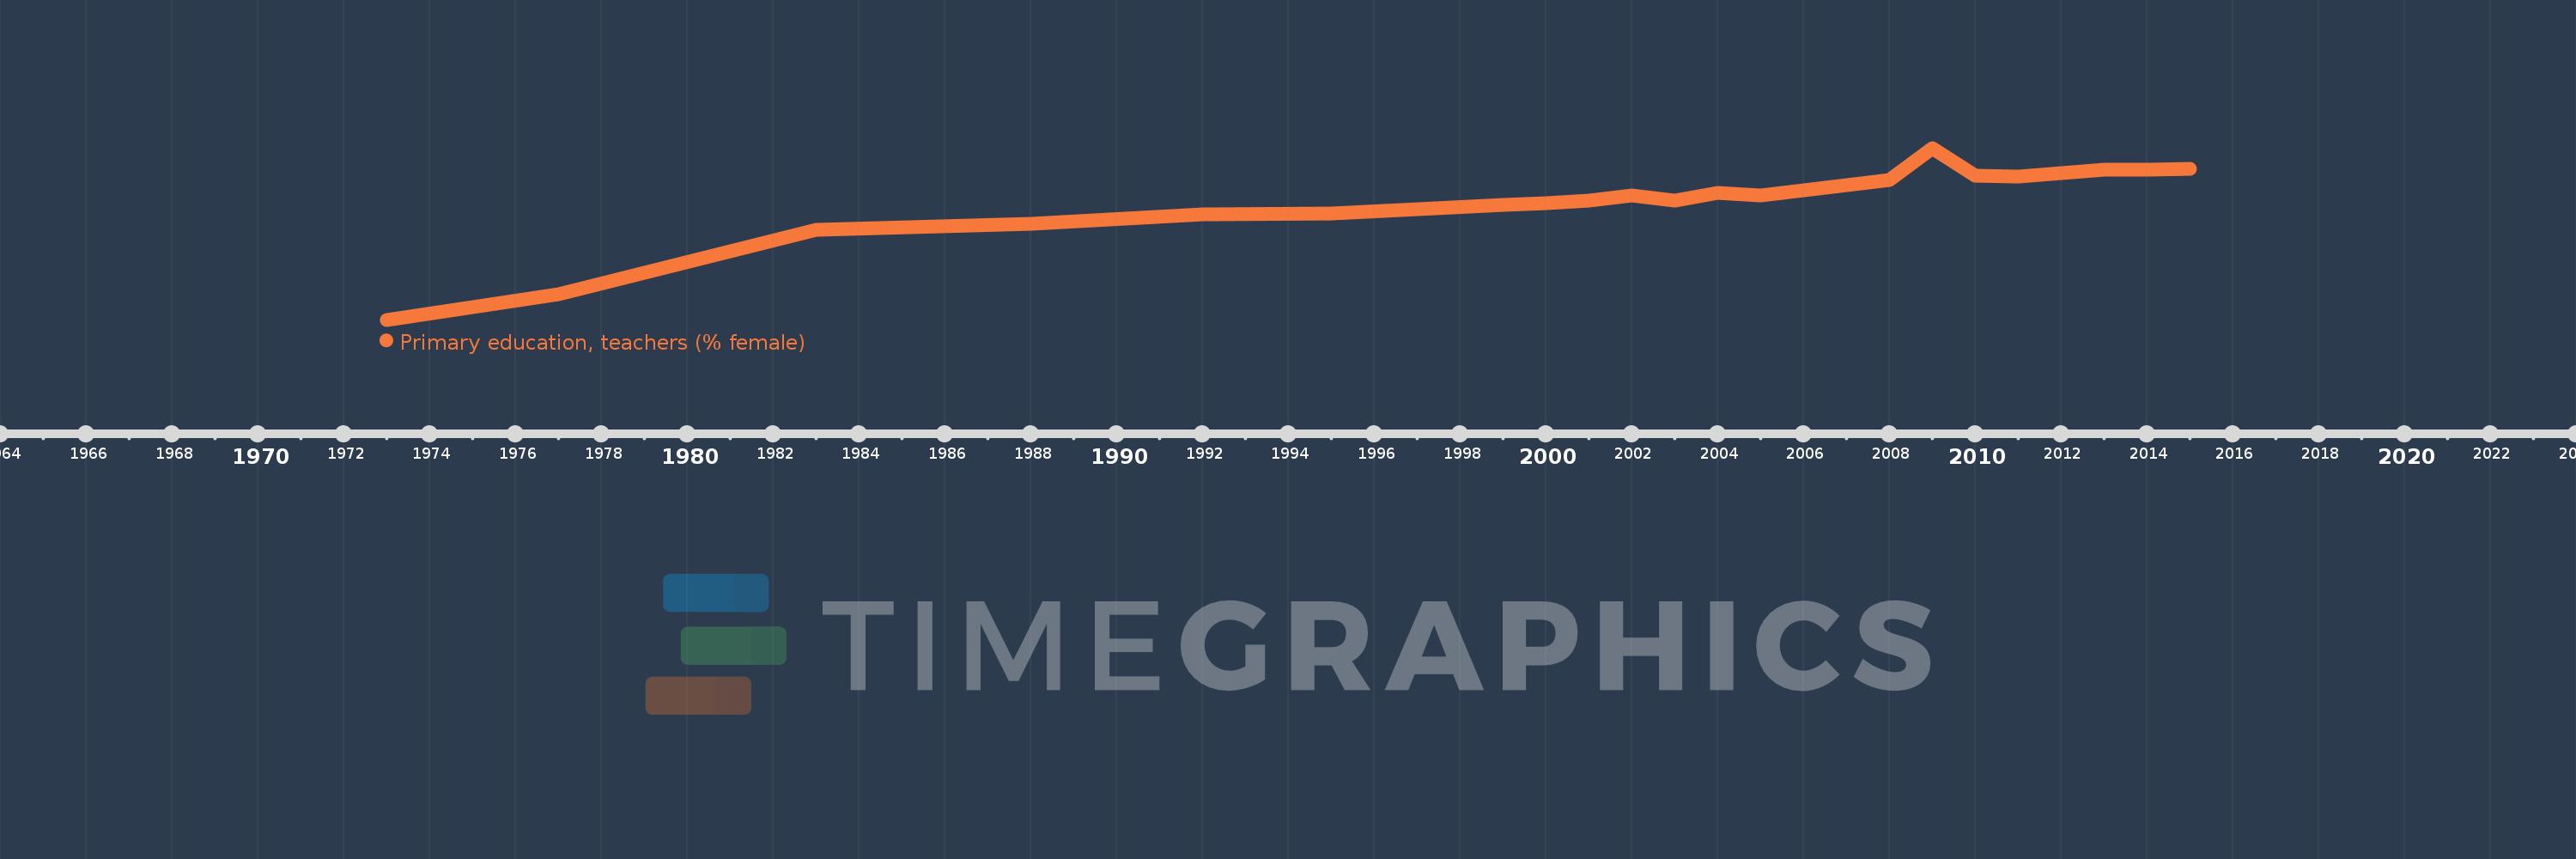
Questa scala temporale mostra un grafico dal 1973 anno al 2015 anno. St. Vincent and the Grenadines. I dati fino ad 1972 anno non disponibili. Il numero di osservazioni attuali secondo i date: 20.
La fonte (nome):
Indicatori dello sviluppo mondiale
La fonte (organizzazione):
United Nations Educational, Scientific, and Cultural Organization (UNESCO) Institute for Statistics.
Categorie:
Education, Gender
sono stati aggiornati
23 apr 2017 anni
Indicatori delle variazioni dei valori per anni
In media:
69.834
Minima:
35.127
1 gen 1973 anni
Massimo:
86.572
1 gen 2009 anni
Alla data di osservazione
Valore
Variazione assoluta
La variazione rispetto al valore precedente
1 gen 1973 anni
35.127
+35.127
0.0%
1 gen 1977 anni
42.81
+7.682
21.87%
1 gen 1983 anni
62.162
+19.352
45.21%
1 gen 1988 anni
63.911
+1.749
2.81%
1 gen 1992 anni
66.667
+2.756
4.31%
1 gen 1995 anni
66.857
+0.19
0.28%
1 gen 1999 anni
69.513
+2.657
3.97%
1 gen 2000 anni
70.02
+0.507
0.73%
1 gen 2001 anni
70.736
+0.717
1.02%
1 gen 2002 anni
72.311
+1.574
2.23%
1 gen 2003 anni
70.925
-1.386
-1.92%
1 gen 2004 anni
73.139
+2.214
3.12%
1 gen 2005 anni
72.397
-0.742
-1.01%
1 gen 2008 anni
77.063
+4.666
6.45%
1 gen 2009 anni
86.572
+9.509
12.34%
1 gen 2010 anni
78.157
-8.415
-9.72%
1 gen 2011 anni
77.903
-0.254
-0.32%
1 gen 2013 anni
80.16
+2.257
2.9%
1 gen 2014 anni
80.0
-0.16
-0.2%
1 gen 2015 anni
80.257
+0.257
0.32%
Classificazione dei paesi secondo i statistiche attuali per anni