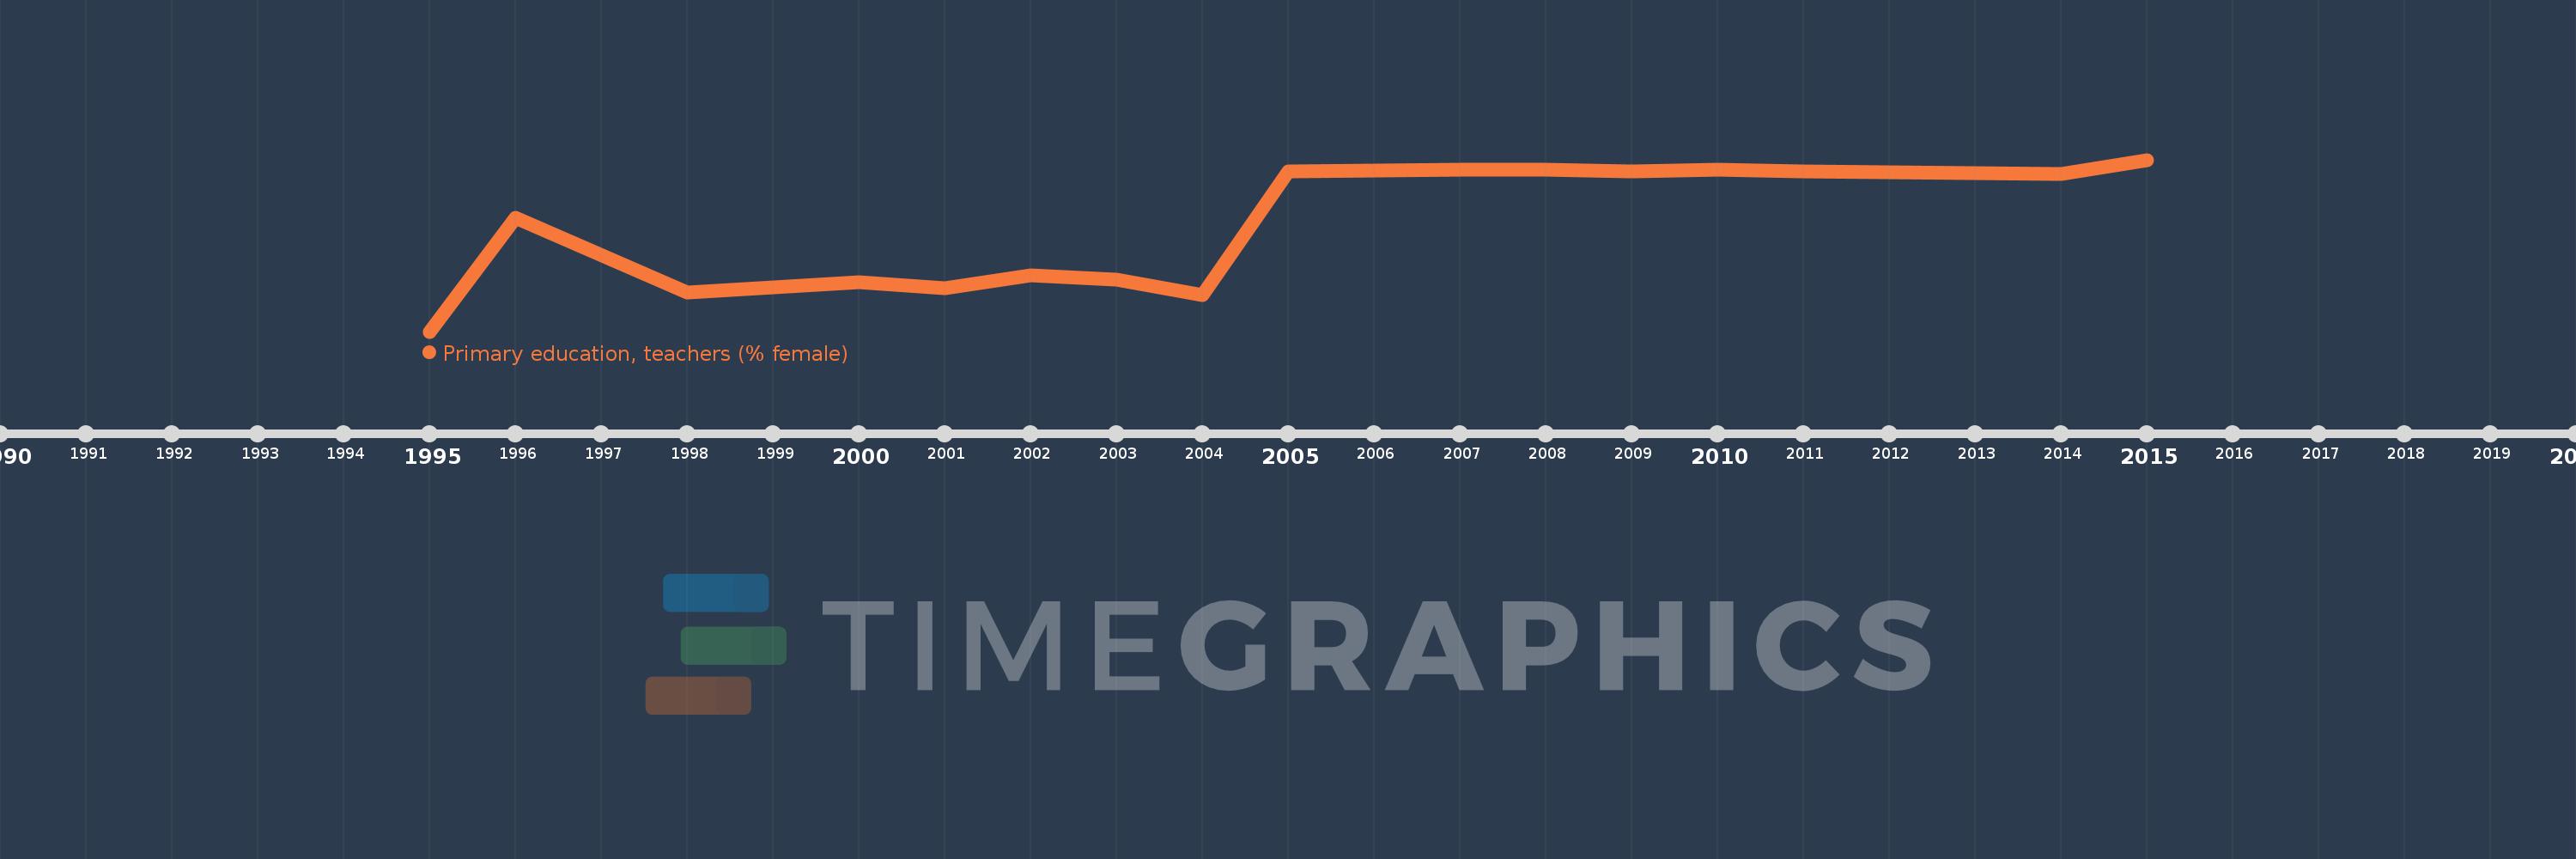
Questa scala temporale mostra un grafico dal 1995 anno al 2015 anno. Hungary. I dati fino ad 1994 anno non disponibili. Il numero di osservazioni attuali secondo i date: 19.
La fonte (nome):
Indicatori dello sviluppo mondiale
La fonte (organizzazione):
United Nations Educational, Scientific, and Cultural Organization (UNESCO) Institute for Statistics.
Categorie:
Education, Gender
sono stati aggiornati
23 apr 2017 anni
Indicatori delle variazioni dei valori per anni
In media:
91.534
Minima:
80.844
1 gen 1995 anni
Massimo:
96.95
1 gen 2015 anni
Alla data di osservazione
Valore
Variazione assoluta
La variazione rispetto al valore precedente
1 gen 1995 anni
80.844
+80.844
0.0%
1 gen 1996 anni
91.553
+10.709
13.25%
1 gen 1998 anni
84.522
-7.032
-7.68%
1 gen 2000 anni
85.451
+0.929
1.1%
1 gen 2001 anni
84.924
-0.526
-0.62%
1 gen 2002 anni
86.154
+1.23
1.45%
1 gen 2003 anni
85.713
-0.441
-0.51%
1 gen 2004 anni
84.26
-1.453
-1.7%
1 gen 2005 anni
95.891
+11.631
13.8%
1 gen 2006 anni
95.95
+0.058
0.06%
1 gen 2007 anni
96.013
+0.063
0.07%
1 gen 2008 anni
96.013
+0.0
0.0%
1 gen 2009 anni
95.899
-0.114
-0.12%
1 gen 2010 anni
96.055
+0.156
0.16%
1 gen 2011 anni
95.894
-0.161
-0.17%
1 gen 2012 anni
95.795
-0.099
-0.1%
1 gen 2013 anni
95.689
-0.106
-0.11%
1 gen 2014 anni
95.585
-0.104
-0.11%
1 gen 2015 anni
96.95
+1.366
1.43%
Classificazione dei paesi secondo i statistiche attuali per anni