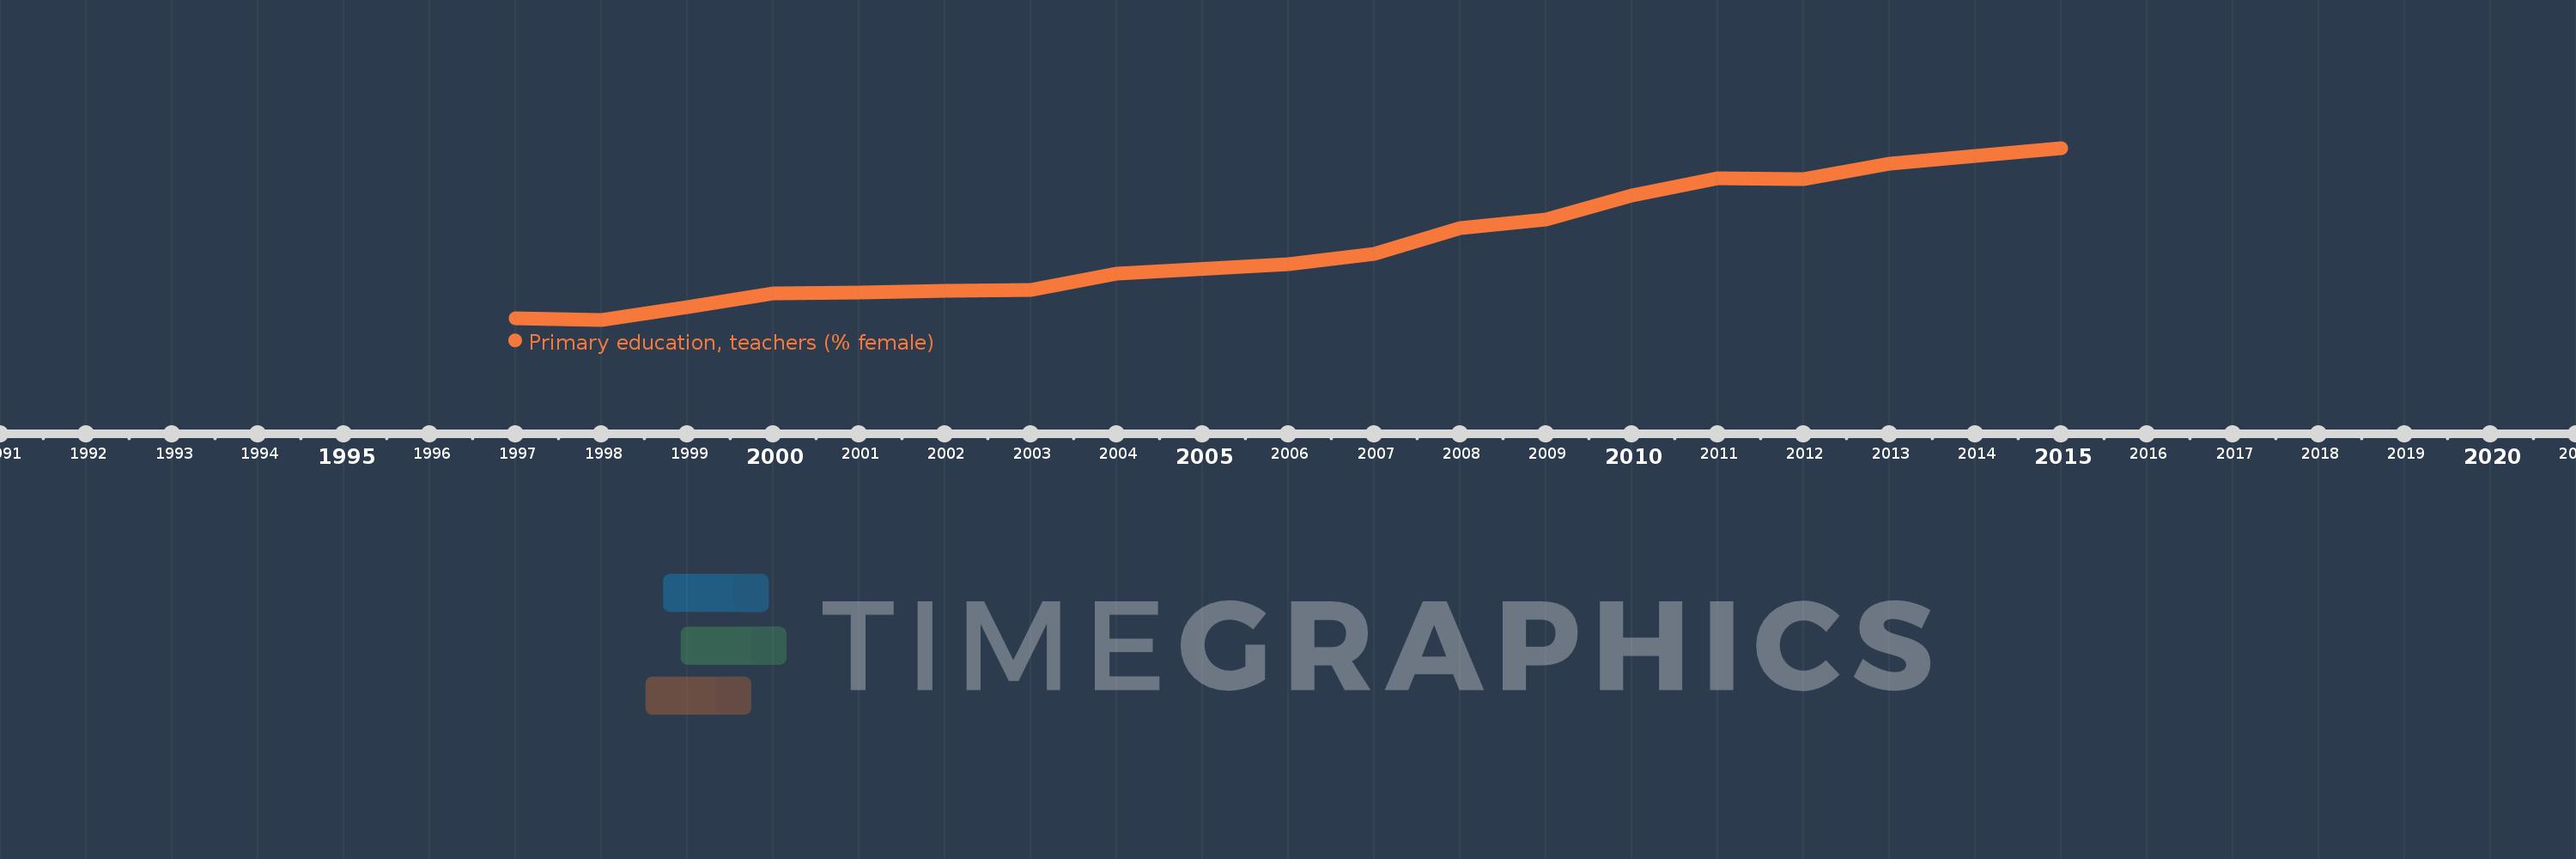
Questa scala temporale mostra un grafico dal 1997 anno al 2015 anno. Croatia. I dati fino ad 1996 anno non disponibili. Il numero di osservazioni attuali secondo i date: 17.
La fonte (nome):
Indicatori dello sviluppo mondiale
La fonte (organizzazione):
United Nations Educational, Scientific, and Cultural Organization (UNESCO) Institute for Statistics.
Categorie:
Education, Gender
sono stati aggiornati
23 apr 2017 anni
Indicatori delle variazioni dei valori per anni
In media:
90.567
Minima:
88.608
1 gen 1998 anni
Massimo:
93.297
1 gen 2015 anni
Alla data di osservazione
Valore
Variazione assoluta
La variazione rispetto al valore precedente
1 gen 1997 anni
88.647
+88.647
0.0%
1 gen 1998 anni
88.608
-0.039
-0.04%
1 gen 1999 anni
88.953
+0.345
0.39%
1 gen 2000 anni
89.317
+0.364
0.41%
1 gen 2001 anni
89.345
+0.028
0.03%
1 gen 2002 anni
89.409
+0.064
0.07%
1 gen 2003 anni
89.424
+0.016
0.02%
1 gen 2004 anni
89.863
+0.439
0.49%
1 gen 2006 anni
90.123
+0.26
0.29%
1 gen 2007 anni
90.399
+0.275
0.31%
1 gen 2008 anni
91.106
+0.707
0.78%
1 gen 2009 anni
91.348
+0.242
0.27%
1 gen 2010 anni
91.996
+0.648
0.71%
1 gen 2011 anni
92.466
+0.469
0.51%
1 gen 2012 anni
92.453
-0.013
-0.01%
1 gen 2013 anni
92.878
+0.425
0.46%
1 gen 2015 anni
93.297
+0.419
0.45%
Classificazione dei paesi secondo i statistiche attuali per anni