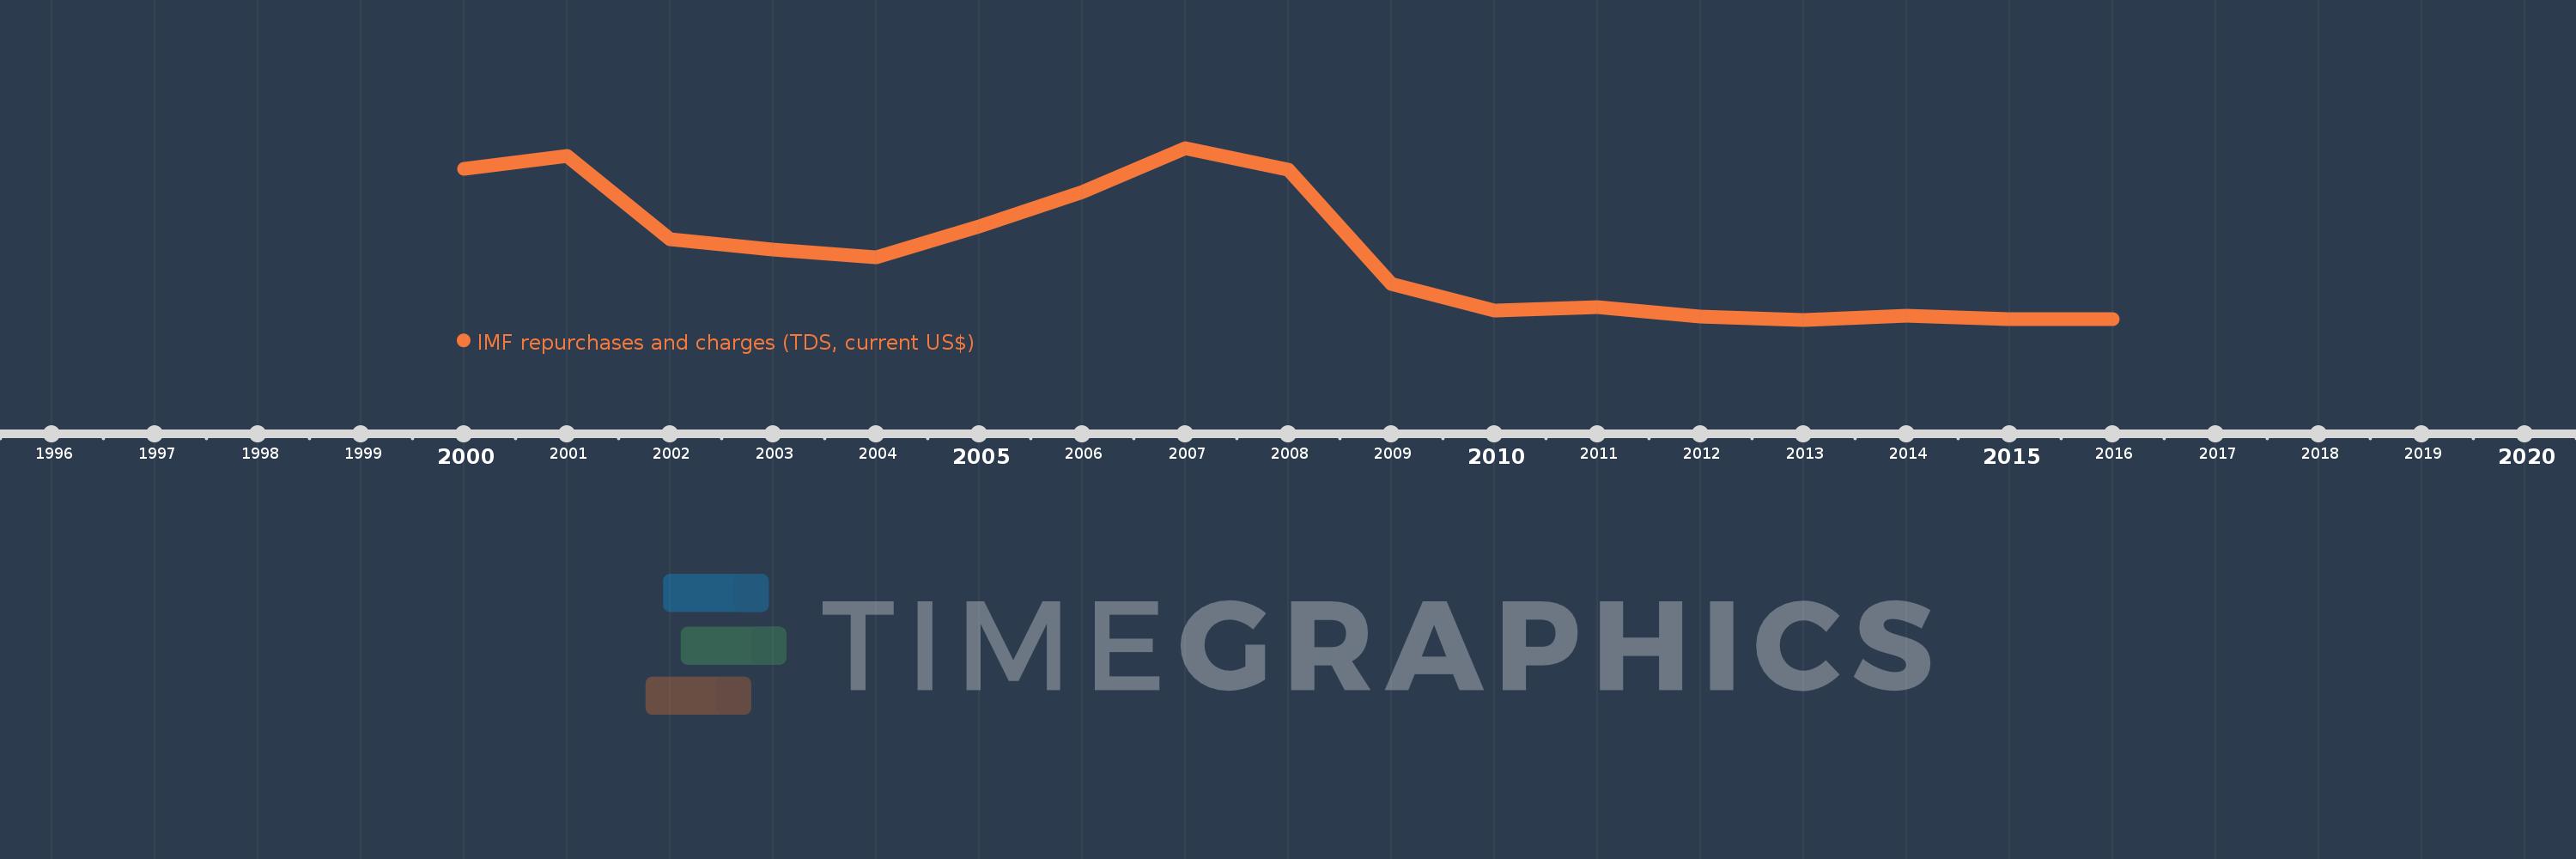
Questa scala temporale mostra un grafico dal 2000 anno al 2016 anno. Bhutan. I dati fino ad 1999 anno non disponibili. Il numero di osservazioni attuali secondo i date: 17.
La fonte (nome):
Indicatori dello sviluppo mondiale
La fonte (organizzazione):
World Bank, International Debt Statistics.
Categorie:
External Debt
sono stati aggiornati
23 apr 2017 anni
Indicatori delle variazioni dei valori per anni
In media:
141.824 Mille.
Minima:
3.0 Mille.
1 gen 2013 anni
Massimo:
359.0 Mille.
1 gen 2007 anni
Alla data di osservazione
Valore
Variazione assoluta
La variazione rispetto al valore precedente
1 gen 2000 anni
316.0 Mille.
+316.0 Mille.
0.0%
1 gen 2001 anni
343.0 Mille.
+27.0 Mille.
8.54%
1 gen 2002 anni
170.0 Mille.
-173.0 Mille.
-50.44%
1 gen 2003 anni
148.0 Mille.
-22.0 Mille.
-12.94%
1 gen 2004 anni
132.0 Mille.
-16.0 Mille.
-10.81%
1 gen 2005 anni
197.0 Mille.
+65.0 Mille.
49.24%
1 gen 2006 anni
268.0 Mille.
+71.0 Mille.
36.04%
1 gen 2007 anni
359.0 Mille.
+91.0 Mille.
33.96%
1 gen 2008 anni
314.0 Mille.
-45.0 Mille.
-12.53%
1 gen 2009 anni
78.0 Mille.
-236.0 Mille.
-75.16%
1 gen 2010 anni
22.0 Mille.
-56.0 Mille.
-71.79%
1 gen 2011 anni
30.0 Mille.
+8.0 Mille.
36.36%
1 gen 2012 anni
10.0 Mille.
-20.0 Mille.
-66.67%
1 gen 2013 anni
3.0 Mille.
-7.0 Mille.
-70.0%
1 gen 2014 anni
12.0 Mille.
+9.0 Mille.
300.0%
1 gen 2015 anni
5.0 Mille.
-7.0 Mille.
-58.33%
1 gen 2016 anni
4.0 Mille.
-1000.0
-20.0%
Classificazione dei paesi secondo i statistiche attuali per anni