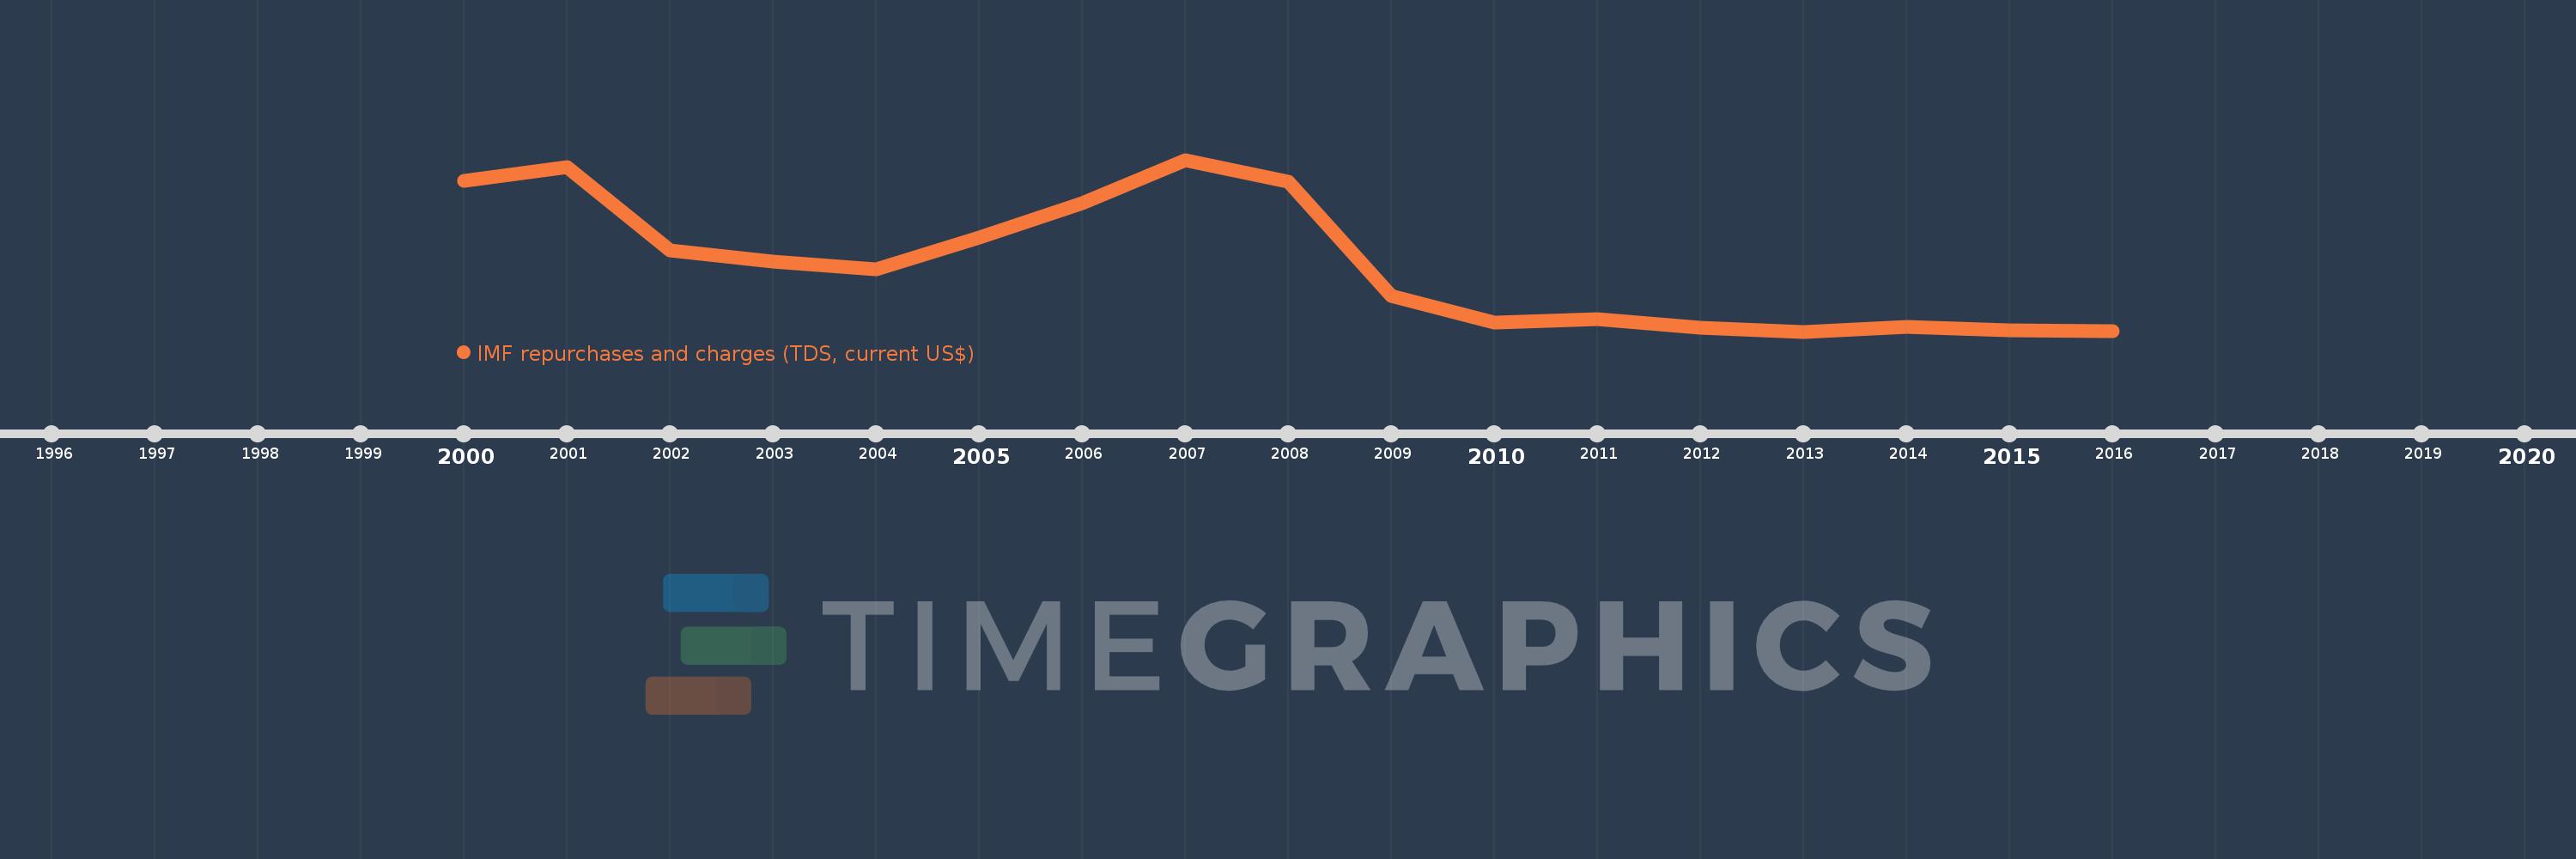
Questa scala temporale mostra un grafico dal 2000 anno al 2016 anno. Tonga. I dati fino ad 1999 anno non disponibili. Il numero di osservazioni attuali secondo i date: 17.
La fonte (nome):
Indicatori dello sviluppo mondiale
La fonte (organizzazione):
World Bank, International Debt Statistics.
Categorie:
External Debt
sono stati aggiornati
23 apr 2017 anni
Indicatori delle variazioni dei valori per anni
In media:
155.706 Mille.
Minima:
3.0 Mille.
1 gen 2013 anni
Massimo:
394.0 Mille.
1 gen 2007 anni
Alla data di osservazione
Valore
Variazione assoluta
La variazione rispetto al valore precedente
1 gen 2000 anni
347.0 Mille.
+347.0 Mille.
0.0%
1 gen 2001 anni
377.0 Mille.
+30.0 Mille.
8.65%
1 gen 2002 anni
187.0 Mille.
-190.0 Mille.
-50.4%
1 gen 2003 anni
163.0 Mille.
-24.0 Mille.
-12.83%
1 gen 2004 anni
145.0 Mille.
-18.0 Mille.
-11.04%
1 gen 2005 anni
217.0 Mille.
+72.0 Mille.
49.66%
1 gen 2006 anni
295.0 Mille.
+78.0 Mille.
35.94%
1 gen 2007 anni
394.0 Mille.
+99.0 Mille.
33.56%
1 gen 2008 anni
345.0 Mille.
-49.0 Mille.
-12.44%
1 gen 2009 anni
85.0 Mille.
-260.0 Mille.
-75.36%
1 gen 2010 anni
24.0 Mille.
-61.0 Mille.
-71.76%
1 gen 2011 anni
32.0 Mille.
+8.0 Mille.
33.33%
1 gen 2012 anni
11.0 Mille.
-21.0 Mille.
-65.63%
1 gen 2013 anni
3.0 Mille.
-8.0 Mille.
-72.73%
1 gen 2014 anni
13.0 Mille.
+10.0 Mille.
333.33%
1 gen 2015 anni
5.0 Mille.
-8.0 Mille.
-61.54%
1 gen 2016 anni
4.0 Mille.
-1000.0
-20.0%
Classificazione dei paesi secondo i statistiche attuali per anni