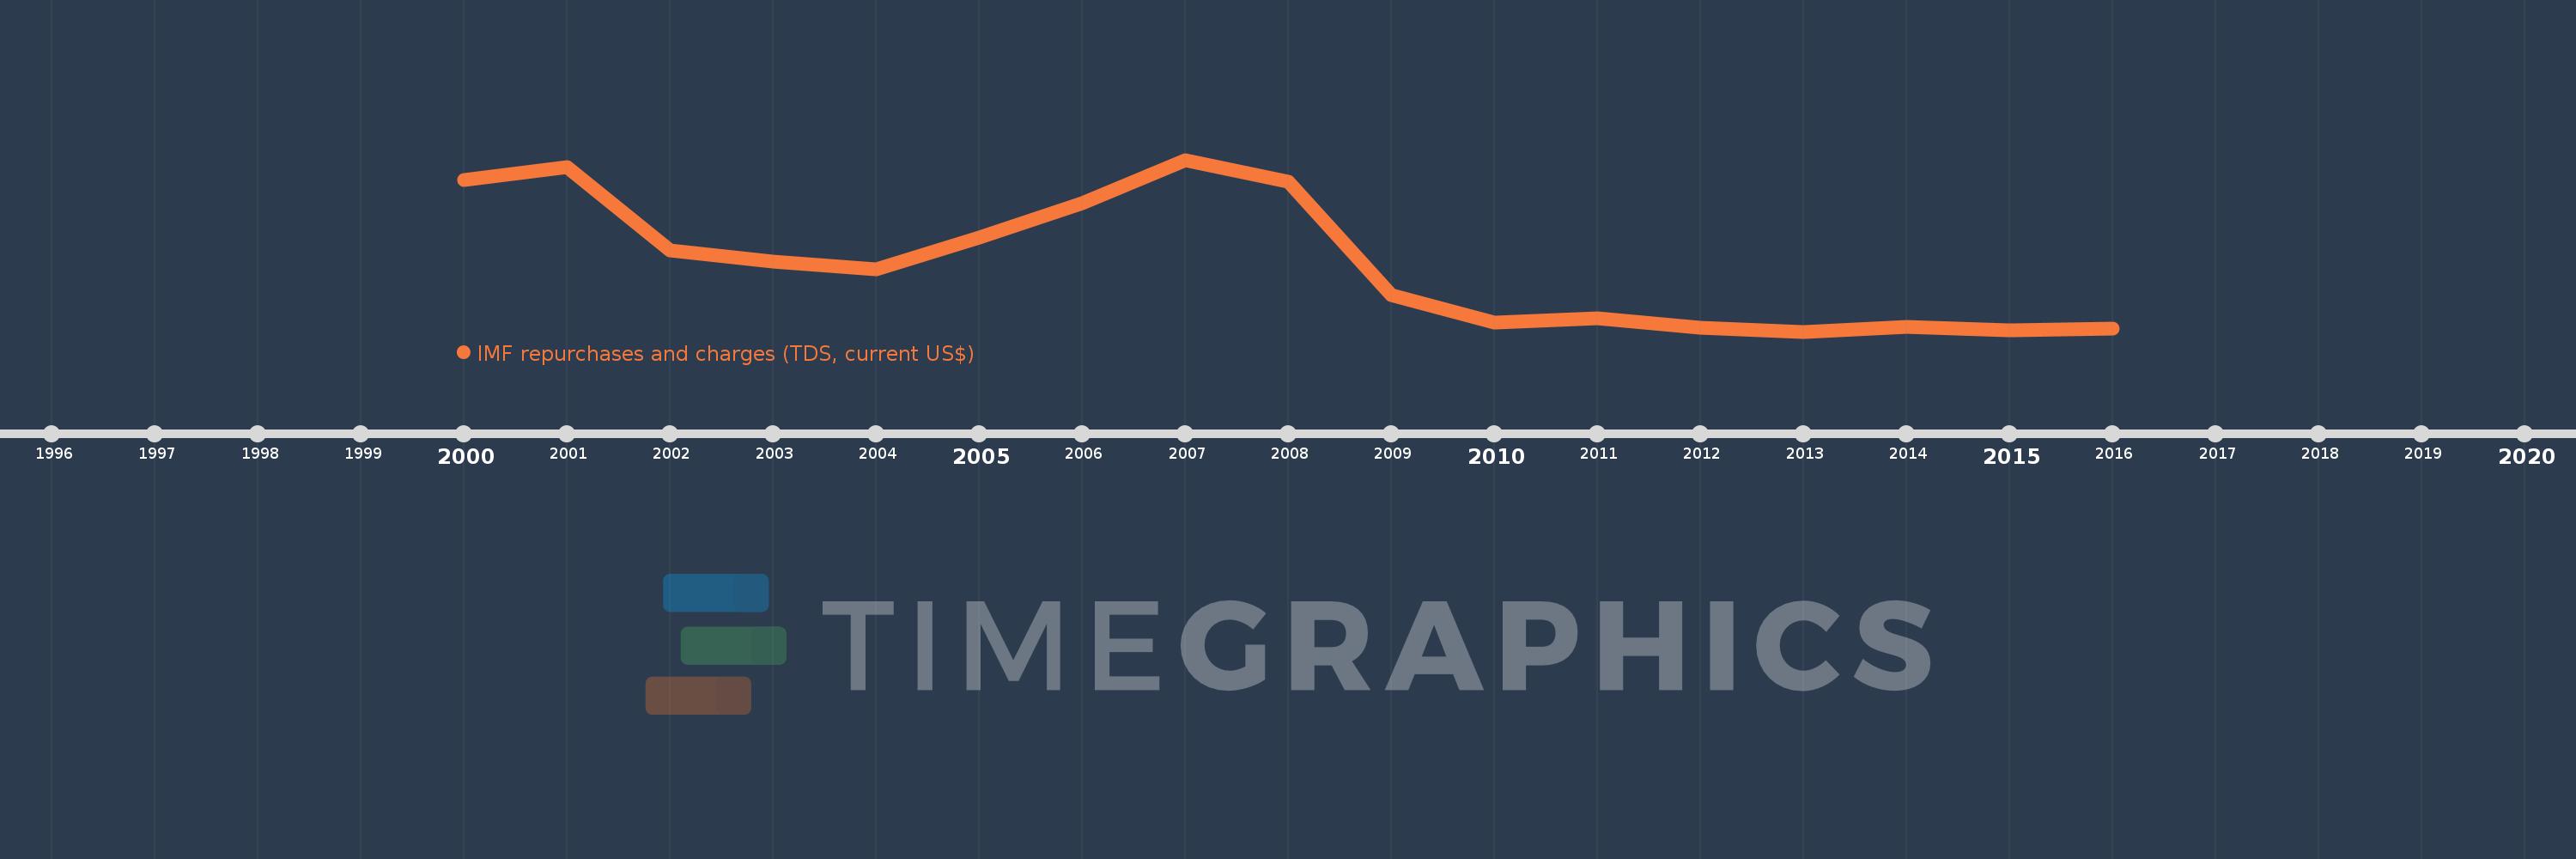
Questa scala temporale mostra un grafico dal 2000 anno al 2016 anno. Vanuatu. I dati fino ad 1999 anno non disponibili. Il numero di osservazioni attuali secondo i date: 17.
La fonte (nome):
Indicatori dello sviluppo mondiale
La fonte (organizzazione):
World Bank, International Debt Statistics.
Categorie:
External Debt
sono stati aggiornati
23 apr 2017 anni
Indicatori delle variazioni dei valori per anni
In media:
385.294 Mille.
Minima:
7.0 Mille.
1 gen 2013 anni
Massimo:
974.0 Mille.
1 gen 2007 anni
Alla data di osservazione
Valore
Variazione assoluta
La variazione rispetto al valore precedente
1 gen 2000 anni
859.0 Mille.
+859.0 Mille.
0.0%
1 gen 2001 anni
931.0 Mille.
+72.0 Mille.
8.38%
1 gen 2002 anni
462.0 Mille.
-469.0 Mille.
-50.38%
1 gen 2003 anni
402.0 Mille.
-60.0 Mille.
-12.99%
1 gen 2004 anni
357.0 Mille.
-45.0 Mille.
-11.19%
1 gen 2005 anni
535.0 Mille.
+178.0 Mille.
49.86%
1 gen 2006 anni
728.0 Mille.
+193.0 Mille.
36.07%
1 gen 2007 anni
974.0 Mille.
+246.0 Mille.
33.79%
1 gen 2008 anni
852.0 Mille.
-122.0 Mille.
-12.53%
1 gen 2009 anni
211.0 Mille.
-641.0 Mille.
-75.23%
1 gen 2010 anni
59.0 Mille.
-152.0 Mille.
-72.04%
1 gen 2011 anni
80.0 Mille.
+21.0 Mille.
35.59%
1 gen 2012 anni
27.0 Mille.
-53.0 Mille.
-66.25%
1 gen 2013 anni
7.0 Mille.
-20.0 Mille.
-74.07%
1 gen 2014 anni
32.0 Mille.
+25.0 Mille.
357.14%
1 gen 2015 anni
12.0 Mille.
-20.0 Mille.
-62.5%
1 gen 2016 anni
22.0 Mille.
+10.0 Mille.
83.33%
Classificazione dei paesi secondo i statistiche attuali per anni