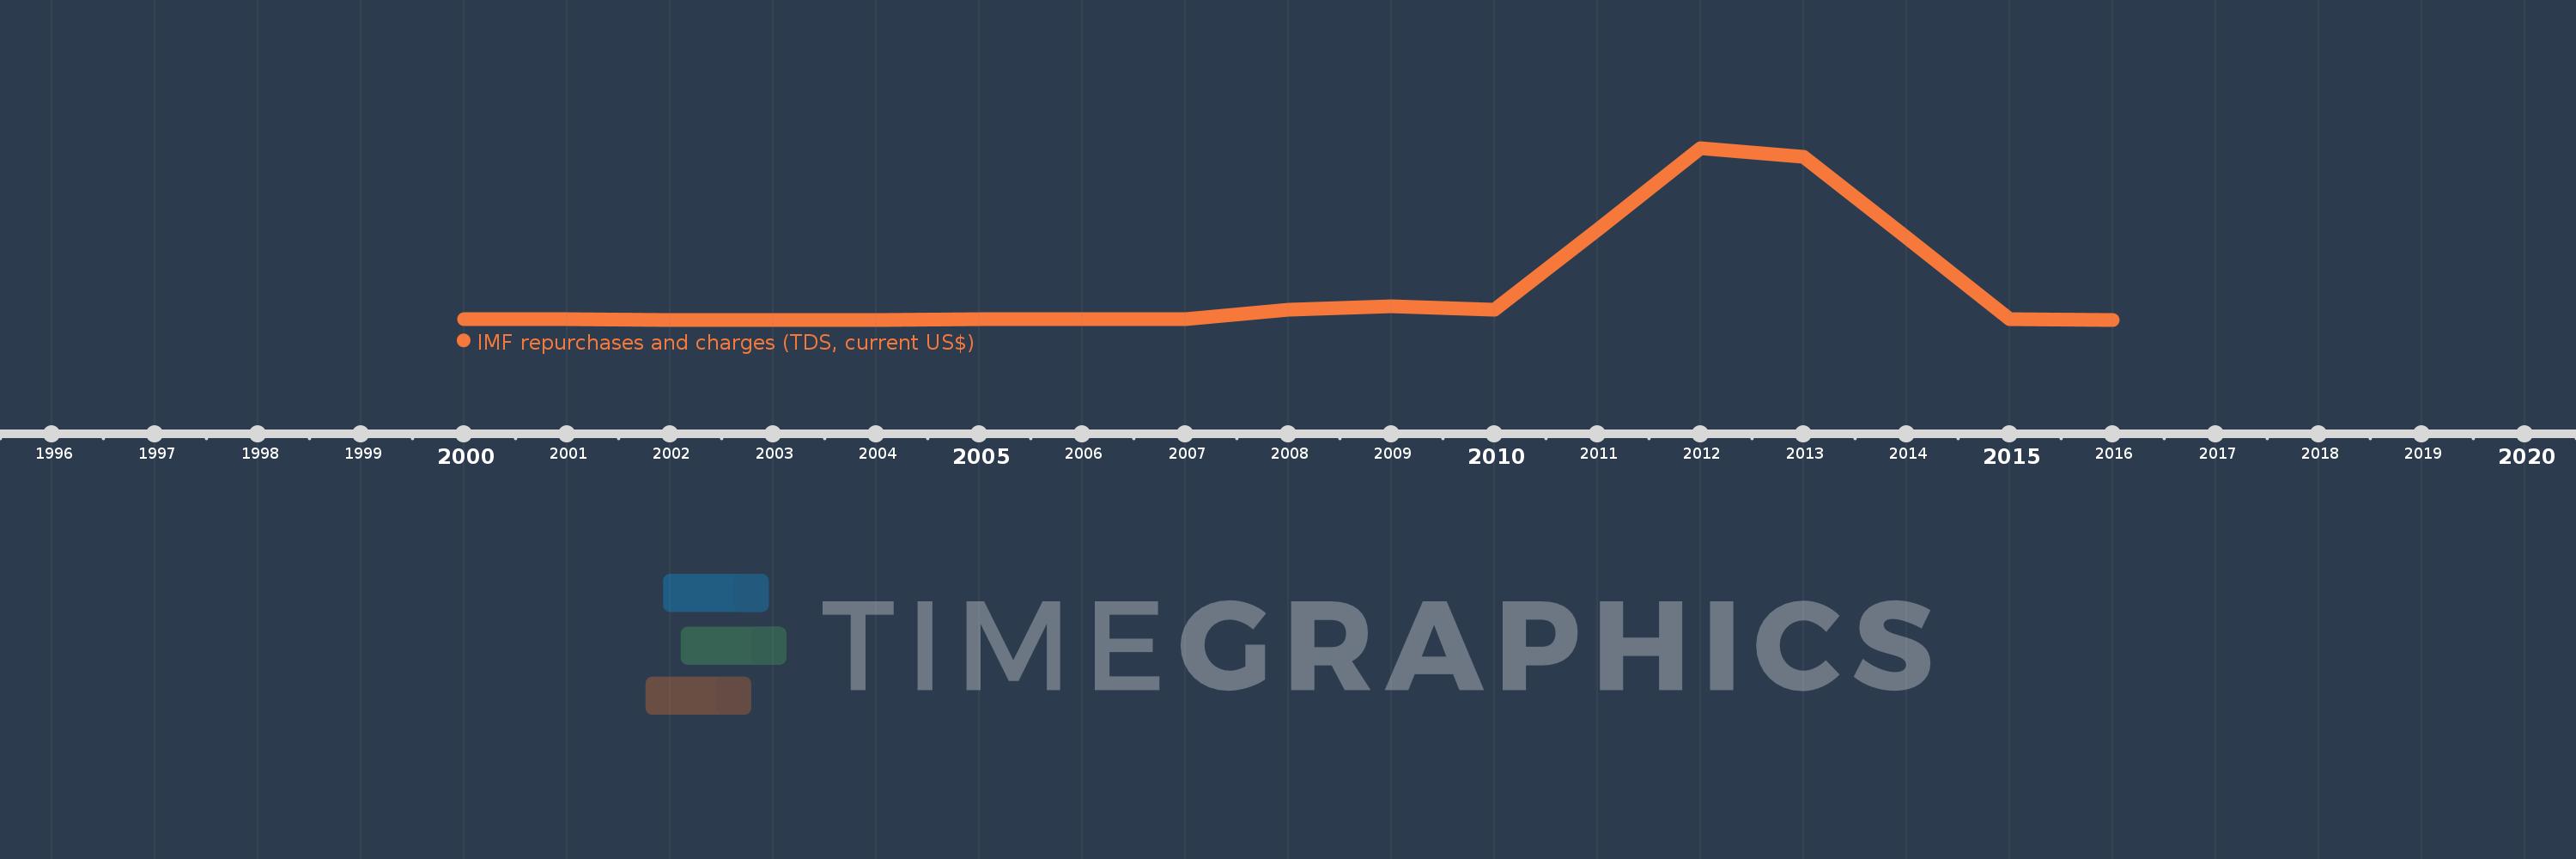
Questa scala temporale mostra un grafico dal 2000 anno al 2016 anno. Lebanon. I dati fino ad 1999 anno non disponibili. Il numero di osservazioni attuali secondo i date: 17.
La fonte (nome):
Indicatori dello sviluppo mondiale
La fonte (organizzazione):
World Bank, International Debt Statistics.
Categorie:
External Debt
sono stati aggiornati
23 apr 2017 anni
Indicatori delle variazioni dei valori per anni
In media:
7.799 Mln
Minima:
96.0 Mille.
1 gen 2004 anni
Massimo:
41.521 Mln
1 gen 2012 anni
Alla data di osservazione
Valore
Variazione assoluta
La variazione rispetto al valore precedente
1 gen 2000 anni
232.0 Mille.
+232.0 Mille.
0.0%
1 gen 2001 anni
251.0 Mille.
+19.0 Mille.
8.19%
1 gen 2002 anni
125.0 Mille.
-126.0 Mille.
-50.2%
1 gen 2003 anni
114.0 Mille.
-11.0 Mille.
-8.8%
1 gen 2004 anni
96.0 Mille.
-18.0 Mille.
-15.79%
1 gen 2005 anni
145.0 Mille.
+49.0 Mille.
51.04%
1 gen 2006 anni
190.0 Mille.
+45.0 Mille.
31.03%
1 gen 2007 anni
269.0 Mille.
+79.0 Mille.
41.58%
1 gen 2008 anni
2.59 Mln
+2.321 Mln
862.83%
1 gen 2009 anni
3.382 Mln
+792.0 Mille.
30.58%
1 gen 2010 anni
2.48 Mln
-902.0 Mille.
-26.67%
1 gen 2011 anni
21.745 Mln
+19.265 Mln
776.81%
1 gen 2012 anni
41.521 Mln
+19.776 Mln
90.95%
1 gen 2013 anni
39.286 Mln
-2.235 Mln
-5.38%
1 gen 2014 anni
19.876 Mln
-19.41 Mln
-49.41%
1 gen 2015 anni
150.0 Mille.
-19.726 Mln
-99.25%
1 gen 2016 anni
136.0 Mille.
-14.0 Mille.
-9.33%
Classificazione dei paesi secondo i statistiche attuali per anni