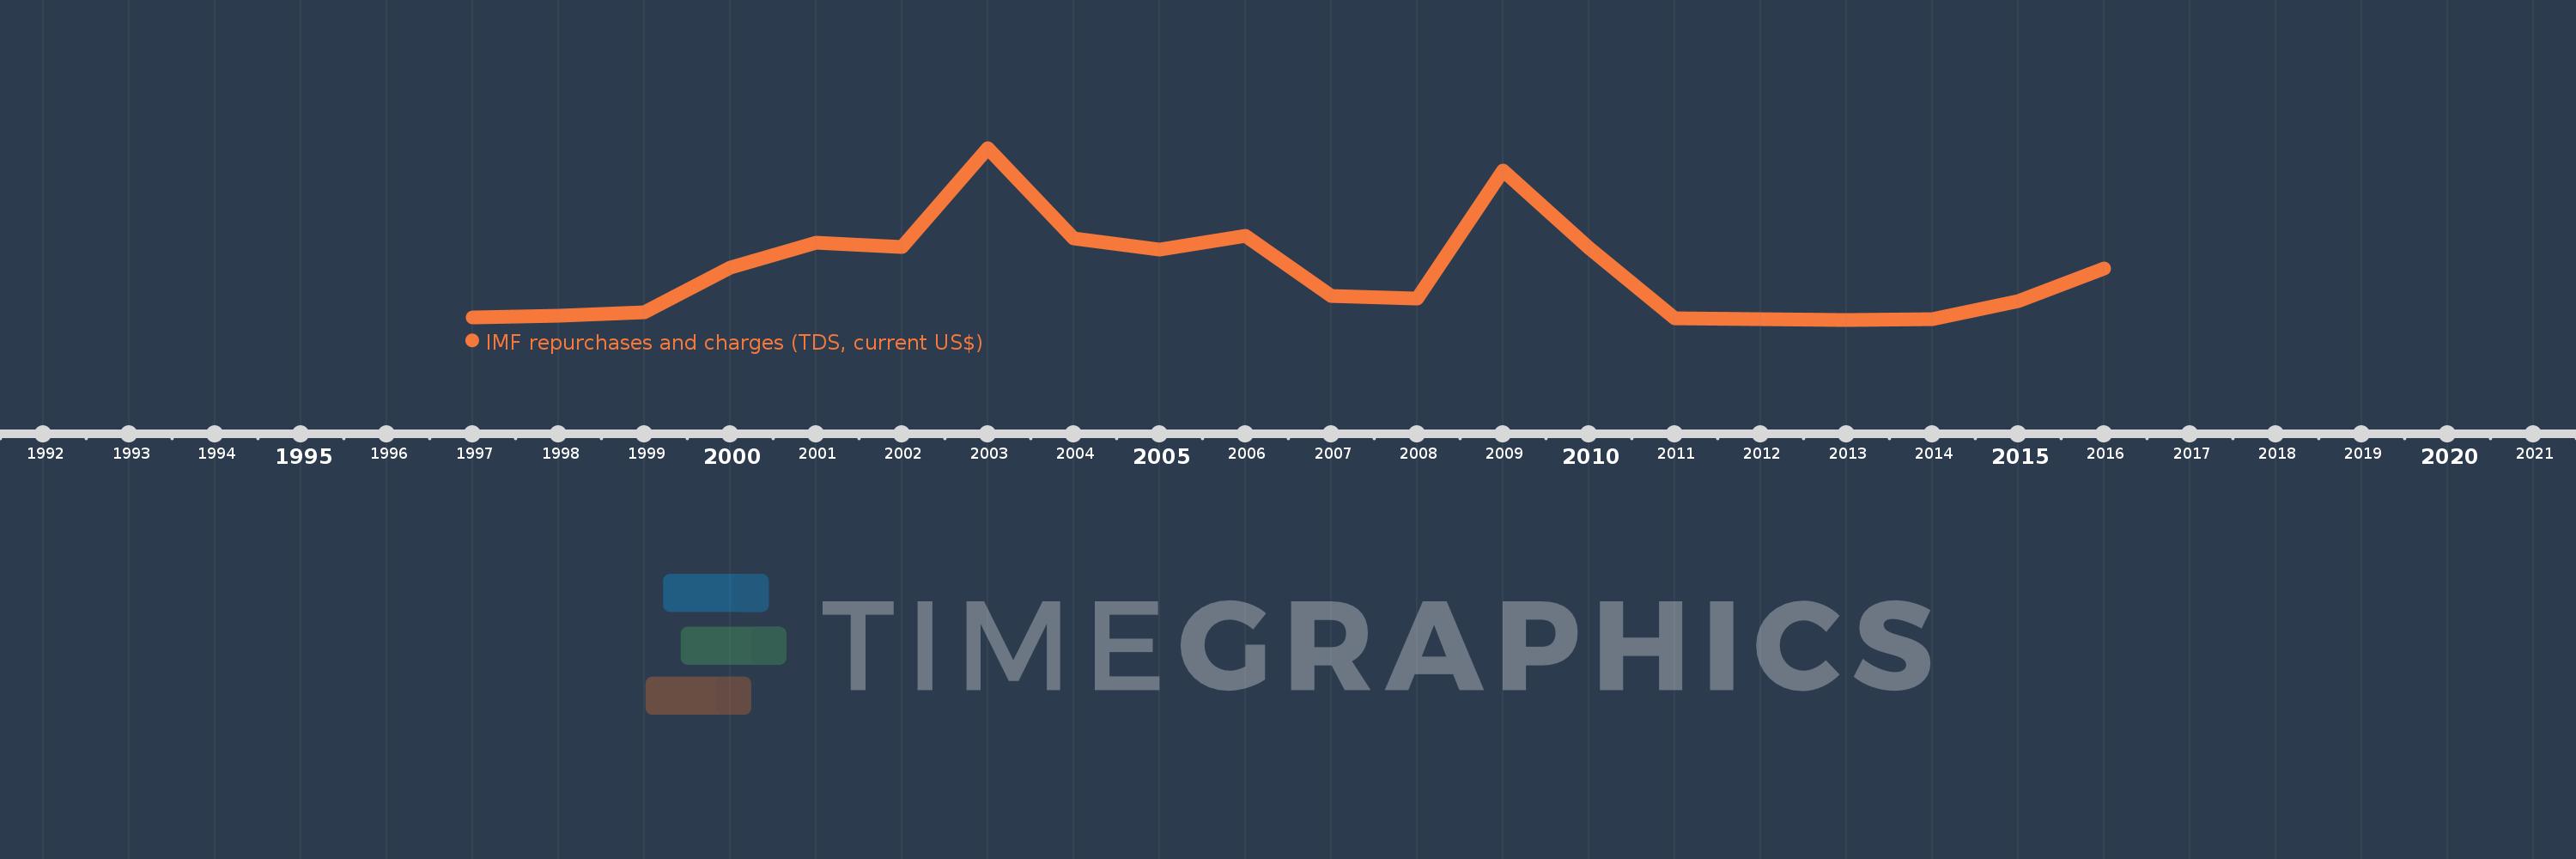
Questa scala temporale mostra un grafico dal 1997 anno al 2016 anno. Tajikistan. I dati fino ad 1996 anno non disponibili. Il numero di osservazioni attuali secondo i date: 20.
La fonte (nome):
Indicatori dello sviluppo mondiale
La fonte (organizzazione):
World Bank, International Debt Statistics.
Categorie:
External Debt
sono stati aggiornati
23 apr 2017 anni
Indicatori delle variazioni dei valori per anni
In media:
10.399 Mln
Minima:
38.0 Mille.
1 gen 2013 anni
Massimo:
37.063 Mln
1 gen 2003 anni
Alla data di osservazione
Valore
Variazione assoluta
La variazione rispetto al valore precedente
1 gen 1997 anni
460.0 Mille.
+460.0 Mille.
0.0%
1 gen 1998 anni
948.0 Mille.
+488.0 Mille.
106.09%
1 gen 1999 anni
1.685 Mln
+737.0 Mille.
77.74%
1 gen 2000 anni
11.358 Mln
+9.673 Mln
574.07%
1 gen 2001 anni
16.567 Mln
+5.209 Mln
45.86%
1 gen 2002 anni
15.653 Mln
-914.0 Mille.
-5.52%
1 gen 2003 anni
37.063 Mln
+21.41 Mln
136.78%
1 gen 2004 anni
17.585 Mln
-19.478 Mln
-52.55%
1 gen 2005 anni
15.224 Mln
-2.361 Mln
-13.43%
1 gen 2006 anni
18.195 Mln
+2.971 Mln
19.52%
1 gen 2007 anni
5.129 Mln
-13.066 Mln
-71.81%
1 gen 2008 anni
4.523 Mln
-606.0 Mille.
-11.82%
1 gen 2009 anni
32.251 Mln
+27.728 Mln
613.04%
1 gen 2010 anni
15.548 Mln
-16.703 Mln
-51.79%
1 gen 2011 anni
410.0 Mille.
-15.138 Mln
-97.36%
1 gen 2012 anni
138.0 Mille.
-272.0 Mille.
-66.34%
1 gen 2013 anni
38.0 Mille.
-100.0 Mille.
-72.46%
1 gen 2014 anni
163.0 Mille.
+125.0 Mille.
328.95%
1 gen 2015 anni
4.027 Mln
+3.864 Mln
2.37 Mille.%
1 gen 2016 anni
11.015 Mln
+6.988 Mln
173.53%
Classificazione dei paesi secondo i statistiche attuali per anni