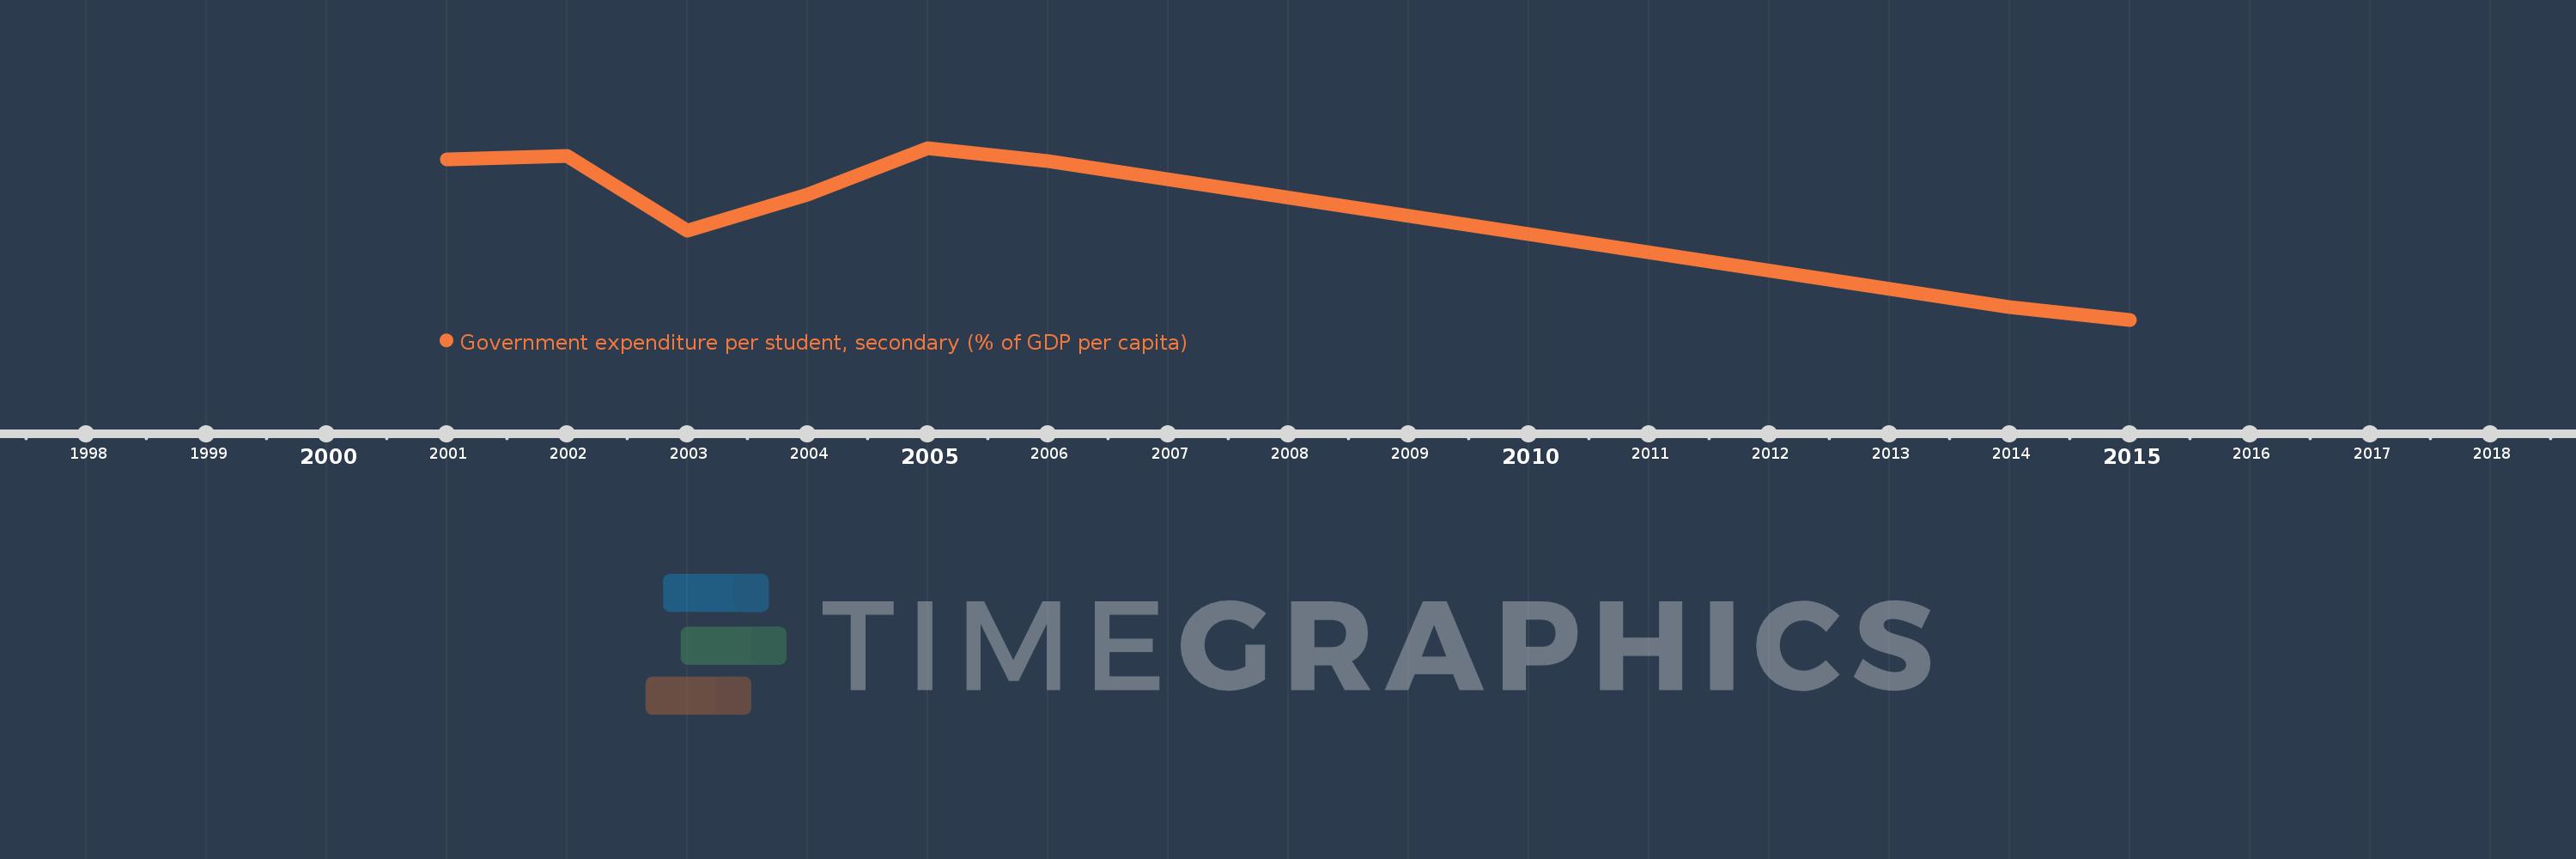
Questa scala temporale mostra un grafico dal 2001 anno al 2015 anno. Benin. I dati fino ad 2000 anno non disponibili. Il numero di osservazioni attuali secondo i date: 8.
La fonte (nome):
Indicatori dello sviluppo mondiale
La fonte (organizzazione):
United Nations Educational, Scientific, and Cultural Organization (UNESCO) Institute for Statistics.
Categorie:
Education
sono stati aggiornati
23 apr 2017 anni
Indicatori delle variazioni dei valori per anni
In media:
19.707
Minima:
13.592
1 gen 2015 anni
Massimo:
23.121
1 gen 2005 anni
Alla data di osservazione
Valore
Variazione assoluta
La variazione rispetto al valore precedente
1 gen 2001 anni
22.5
+22.5
0.0%
1 gen 2002 anni
22.676
+0.176
0.78%
1 gen 2003 anni
18.534
-4.142
-18.26%
1 gen 2004 anni
20.525
+1.991
10.74%
1 gen 2005 anni
23.121
+2.596
12.65%
1 gen 2006 anni
22.396
-0.725
-3.13%
1 gen 2014 anni
14.313
-8.083
-36.09%
1 gen 2015 anni
13.592
-0.721
-5.04%
Classificazione dei paesi secondo i statistiche attuali per anni