Questa scala temporale mostra un grafico dal 2000 anno al 2006 anno. Aruba. I dati fino ad 1999 anno non disponibili. Il numero di osservazioni attuali secondo i date: 6.
La fonte (nome):
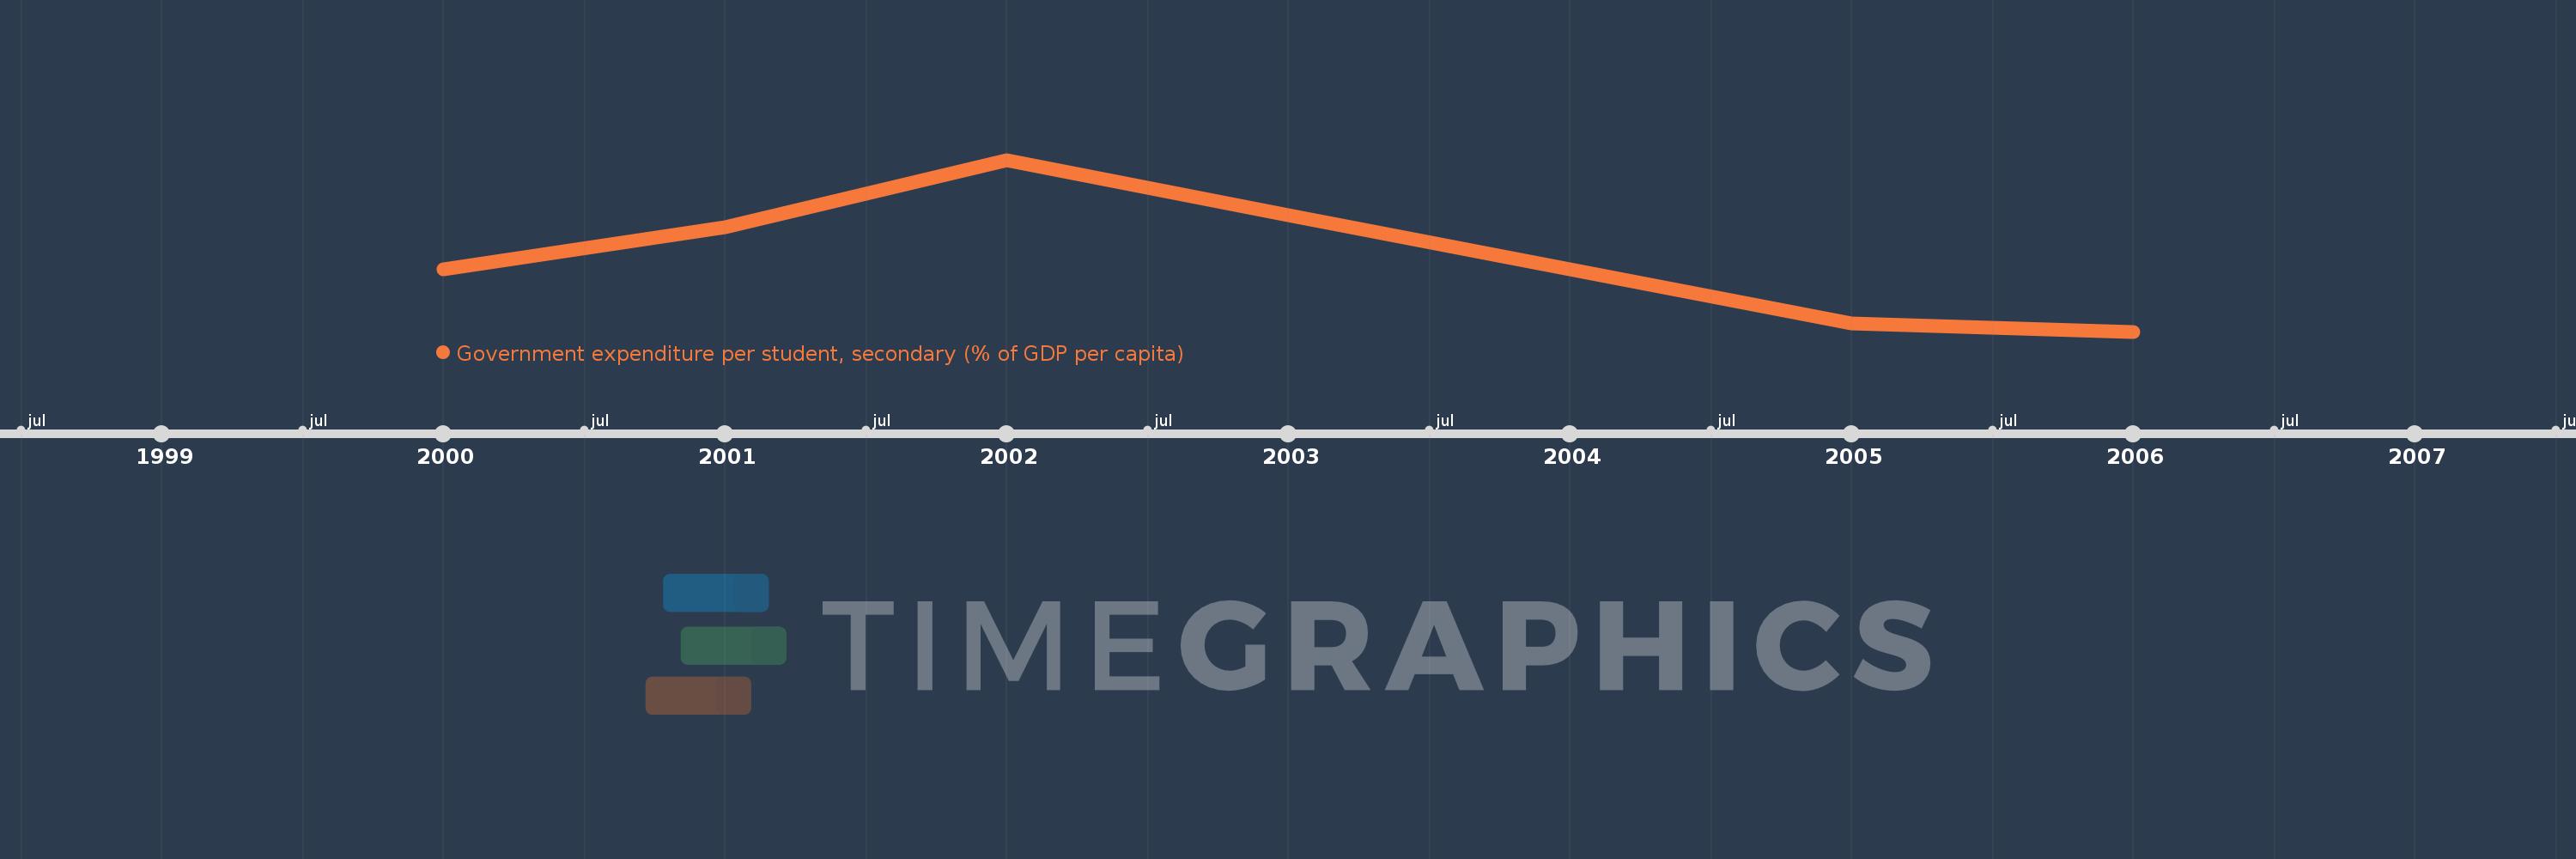
Indicatori dello sviluppo mondiale
La fonte (organizzazione):
United Nations Educational, Scientific, and Cultural Organization (UNESCO) Institute for Statistics.
Categorie:
Education
sono stati aggiornati
23 apr 2017 anni
Indicatori delle variazioni dei valori per anni
In media:
18.793
Minima:
17.613
1 gen 2006 anni
Massimo:
20.24
1 gen 2002 anni
Alla data di osservazione
Valore
Variazione assoluta
La variazione rispetto al valore precedente
1 gen 2000 anni
18.562
+18.562
0.0%
1 gen 2001 anni
19.205
+0.643
3.47%
1 gen 2002 anni
20.24
+1.035
5.39%
1 gen 2003 anni
19.392
-0.848
-4.19%
1 gen 2005 anni
17.744
-1.649
-8.5%
1 gen 2006 anni
17.613
-0.131
-0.74%
Classificazione dei paesi secondo i statistiche attuali per anni