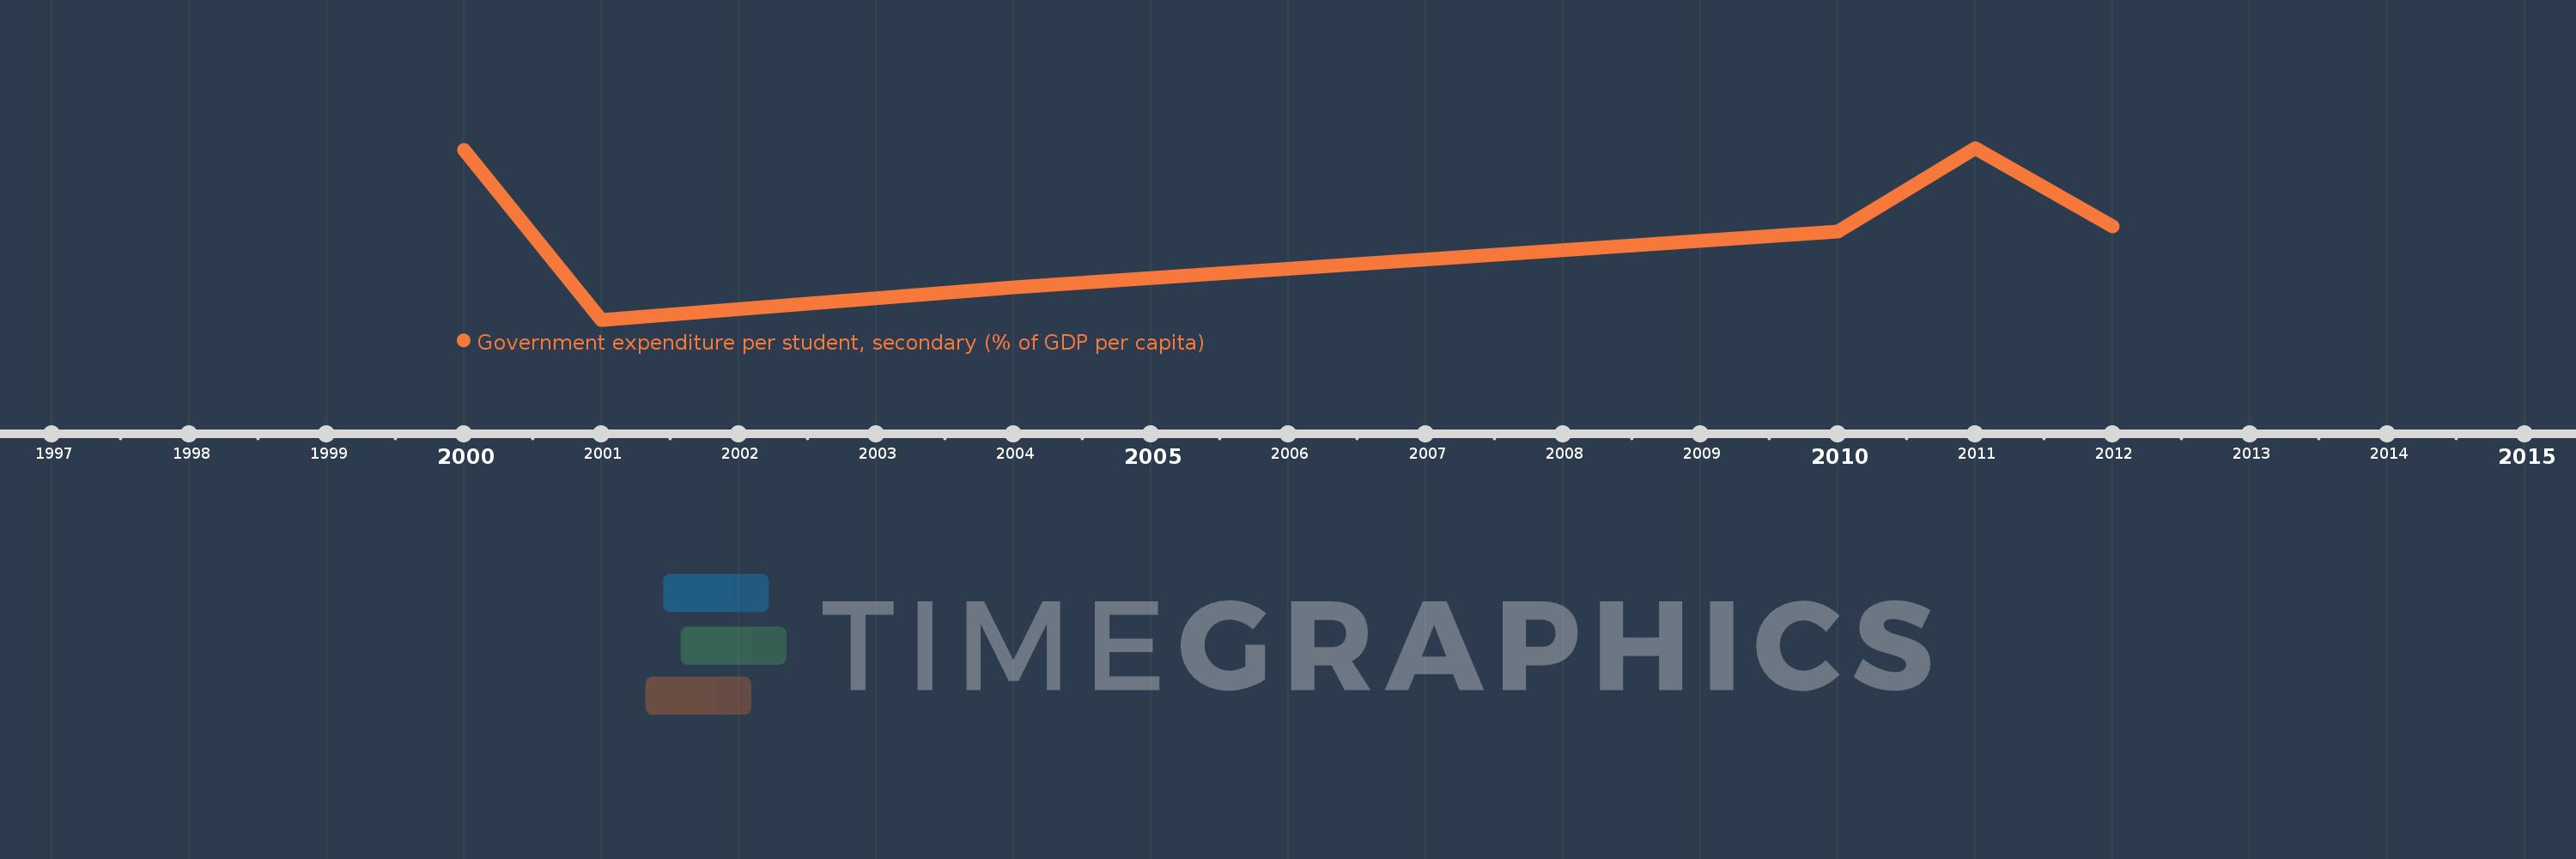
Questa scala temporale mostra un grafico dal 2000 anno al 2012 anno. South Asia (IDA & IBRD). I dati fino ad 1999 anno non disponibili. Il numero di osservazioni attuali secondo i date: 6.
La fonte (nome):
Indicatori dello sviluppo mondiale
La fonte (organizzazione):
United Nations Educational, Scientific, and Cultural Organization (UNESCO) Institute for Statistics.
Categorie:
Education
sono stati aggiornati
23 apr 2017 anni
Indicatori delle variazioni dei valori per anni
In media:
12.162
Minima:
11.297
1 gen 2001 anni
Massimo:
12.904
1 gen 2011 anni
Alla data di osservazione
Valore
Variazione assoluta
La variazione rispetto al valore precedente
1 gen 2000 anni
12.883
+12.883
0.0%
1 gen 2001 anni
11.297
-1.586
-12.31%
1 gen 2004 anni
11.597
+0.3
2.65%
1 gen 2010 anni
12.121
+0.524
4.52%
1 gen 2011 anni
12.904
+0.783
6.46%
1 gen 2012 anni
12.17
-0.734
-5.69%
Classificazione dei paesi secondo i statistiche attuali per anni