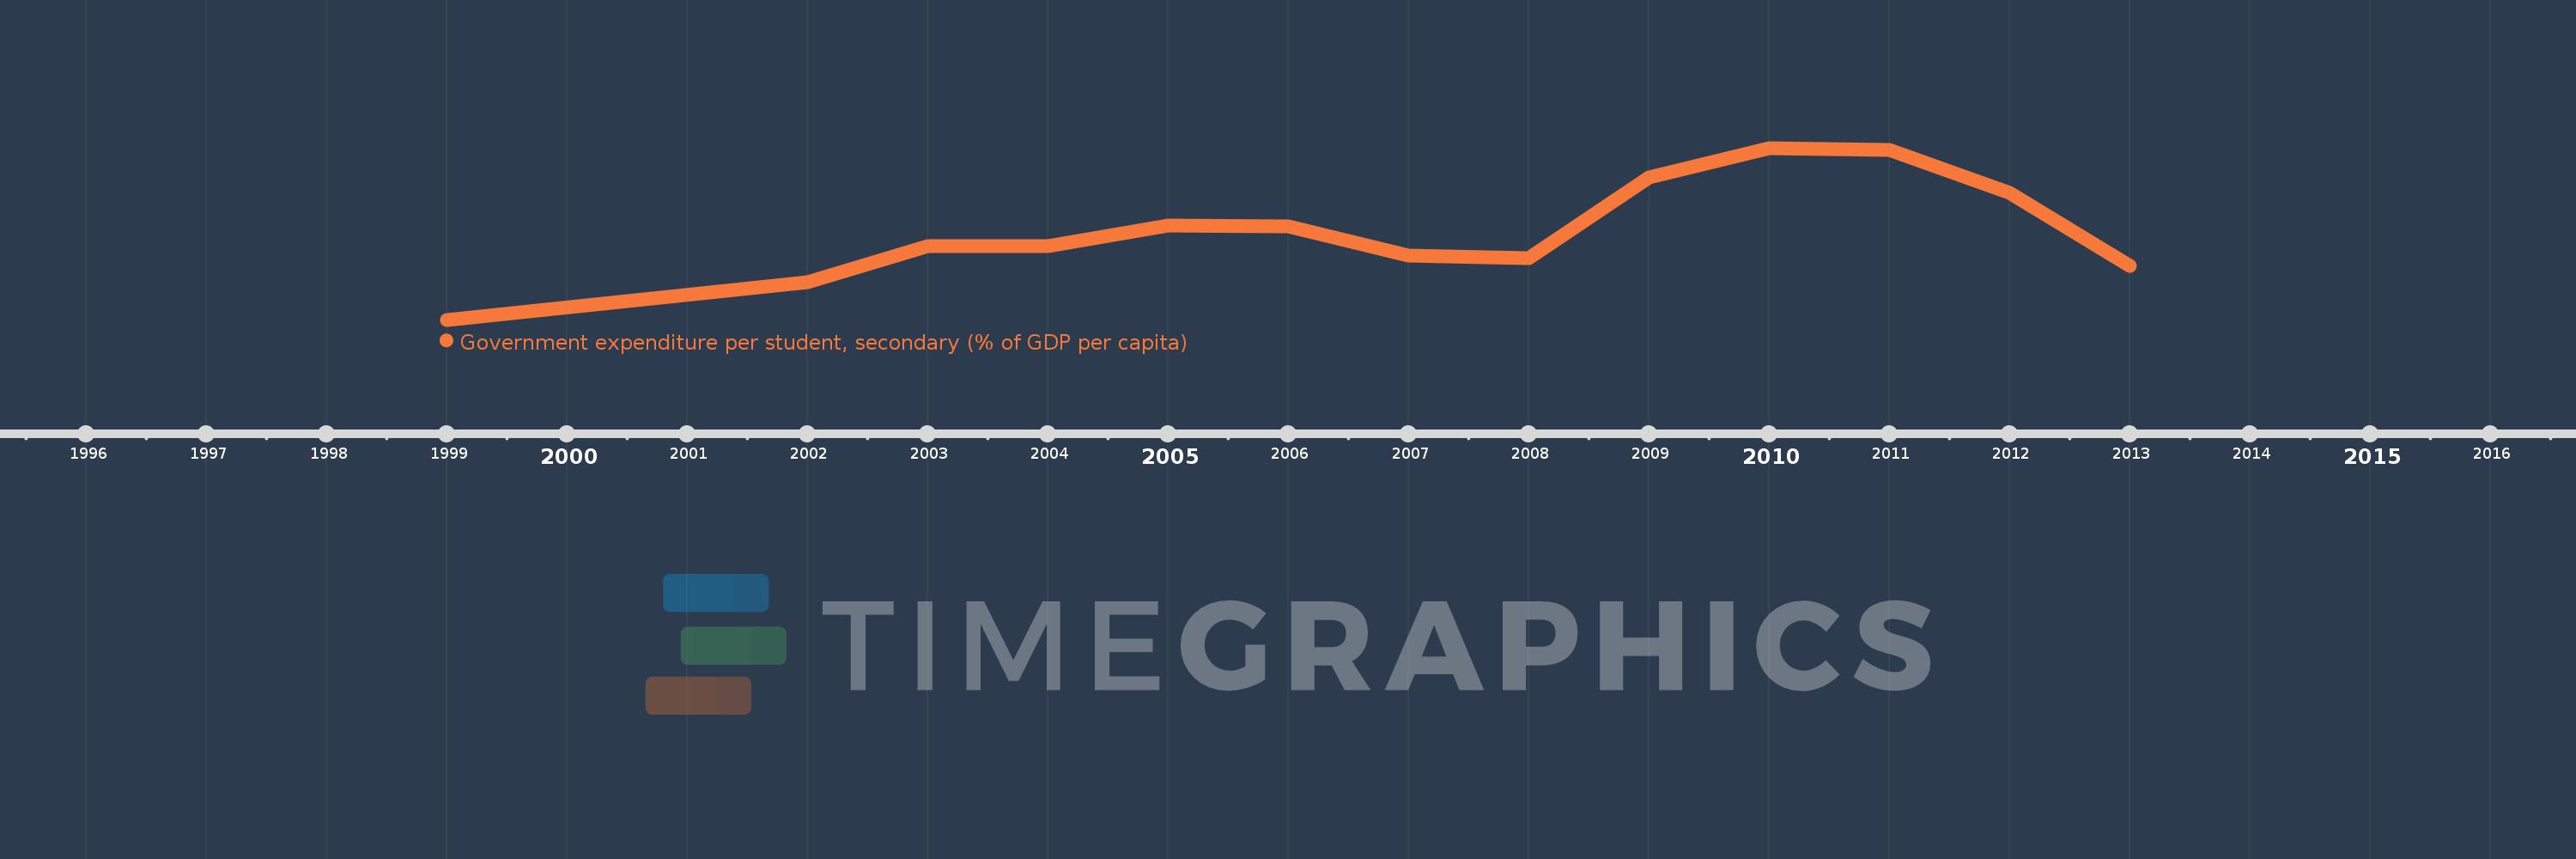
Questa scala temporale mostra un grafico dal 1999 anno al 2013 anno. Central Europe and the Baltics. I dati fino ad 1998 anno non disponibili. Il numero di osservazioni attuali secondo i date: 13.
La fonte (nome):
Indicatori dello sviluppo mondiale
La fonte (organizzazione):
United Nations Educational, Scientific, and Cultural Organization (UNESCO) Institute for Statistics.
Categorie:
Education
sono stati aggiornati
23 apr 2017 anni
Indicatori delle variazioni dei valori per anni
In media:
21.034
Minima:
18.461
1 gen 1999 anni
Massimo:
23.401
1 gen 2010 anni
Alla data di osservazione
Valore
Variazione assoluta
La variazione rispetto al valore precedente
1 gen 1999 anni
18.461
+18.461
0.0%
1 gen 2002 anni
19.529
+1.068
5.79%
1 gen 2003 anni
20.582
+1.053
5.39%
1 gen 2004 anni
20.585
+0.002
0.01%
1 gen 2005 anni
21.162
+0.578
2.81%
1 gen 2006 anni
21.143
-0.02
-0.09%
1 gen 2007 anni
20.316
-0.826
-3.91%
1 gen 2008 anni
20.241
-0.076
-0.37%
1 gen 2009 anni
22.553
+2.313
11.43%
1 gen 2010 anni
23.401
+0.848
3.76%
1 gen 2011 anni
23.355
-0.046
-0.2%
1 gen 2012 anni
22.102
-1.253
-5.36%
1 gen 2013 anni
20.008
-2.094
-9.48%
Classificazione dei paesi secondo i statistiche attuali per anni