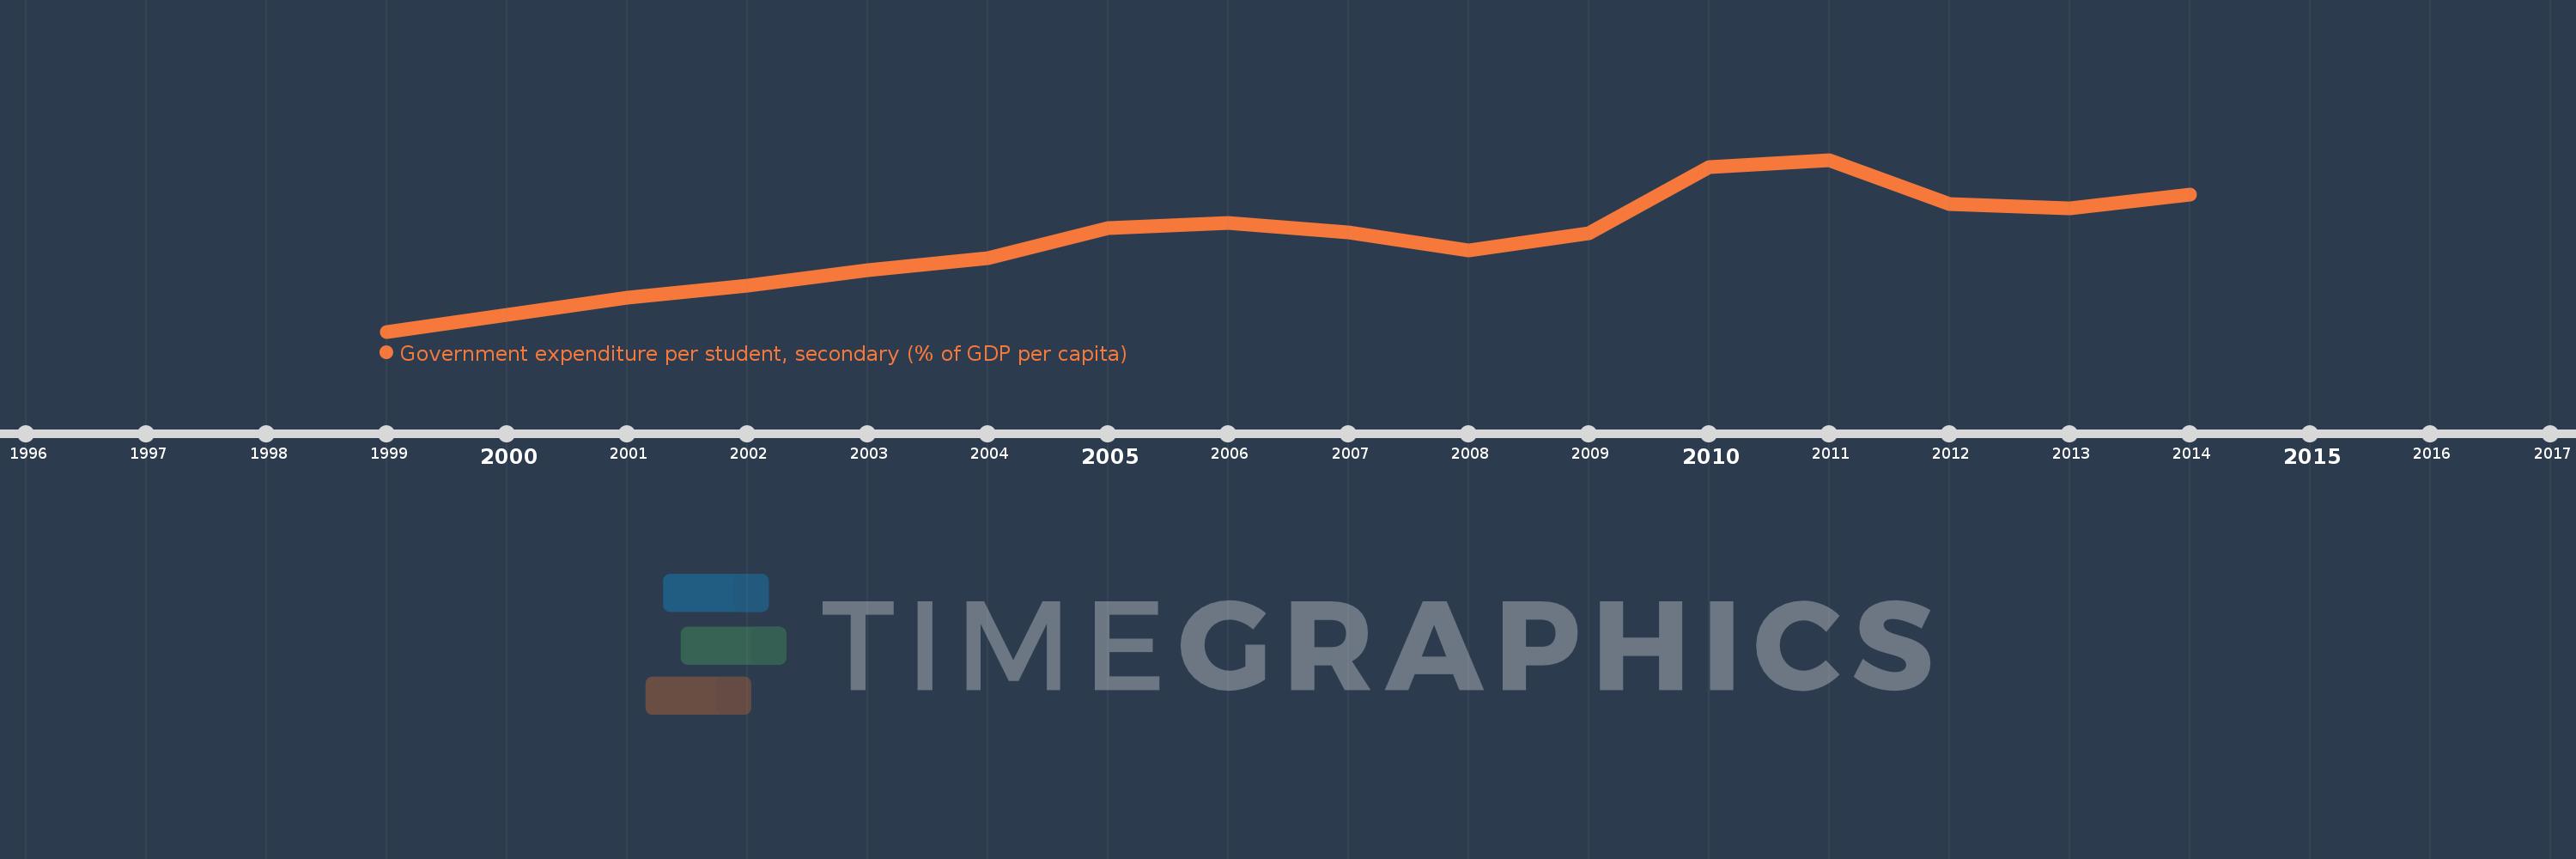
Questa scala temporale mostra un grafico dal 1999 anno al 2014 anno. Netherlands. I dati fino ad 1998 anno non disponibili. Il numero di osservazioni attuali secondo i date: 16.
La fonte (nome):
Indicatori dello sviluppo mondiale
La fonte (organizzazione):
United Nations Educational, Scientific, and Cultural Organization (UNESCO) Institute for Statistics.
Categorie:
Education
sono stati aggiornati
23 apr 2017 anni
Indicatori delle variazioni dei valori per anni
In media:
22.975
Minima:
20.212
1 gen 1999 anni
Massimo:
25.46
1 gen 2011 anni
Alla data di osservazione
Valore
Variazione assoluta
La variazione rispetto al valore precedente
1 gen 1999 anni
20.212
+20.212
0.0%
1 gen 2000 anni
20.714
+0.502
2.48%
1 gen 2001 anni
21.251
+0.537
2.59%
1 gen 2002 anni
21.612
+0.361
1.7%
1 gen 2003 anni
22.098
+0.486
2.25%
1 gen 2004 anni
22.451
+0.353
1.6%
1 gen 2005 anni
23.387
+0.936
4.17%
1 gen 2006 anni
23.524
+0.137
0.59%
1 gen 2007 anni
23.234
-0.29
-1.23%
1 gen 2008 anni
22.688
-0.545
-2.35%
1 gen 2009 anni
23.223
+0.534
2.35%
1 gen 2010 anni
25.24
+2.018
8.69%
1 gen 2011 anni
25.46
+0.22
0.87%
1 gen 2012 anni
24.121
-1.339
-5.26%
1 gen 2013 anni
23.987
-0.134
-0.55%
1 gen 2014 anni
24.398
+0.41
1.71%
Classificazione dei paesi secondo i statistiche attuali per anni