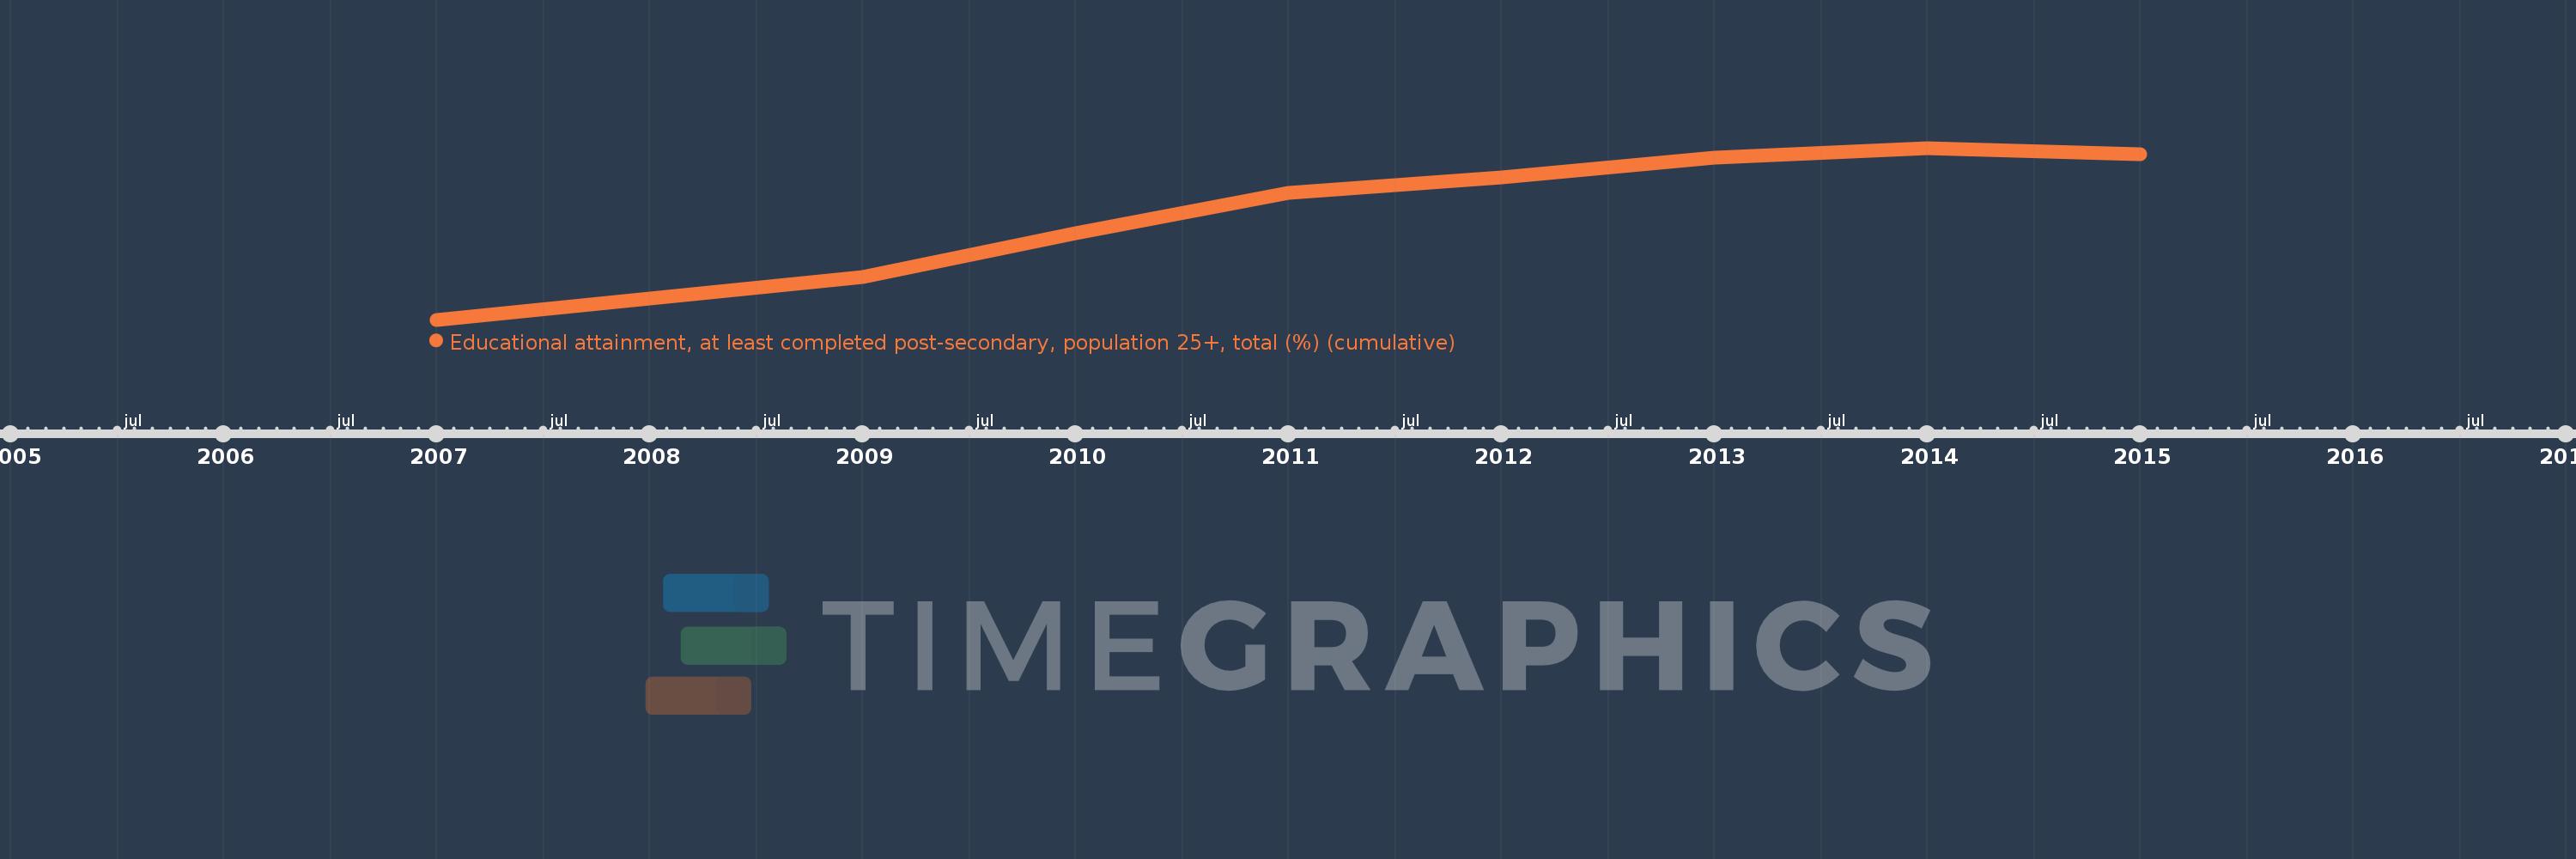
Questa scala temporale mostra un grafico dal 2007 anno al 2015 anno. Belgium. I dati fino ad 2006 anno non disponibili. Il numero di osservazioni attuali secondo i date: 8.
La fonte (nome):
Indicatori dello sviluppo mondiale
La fonte (organizzazione):
United Nations Educational, Scientific, and Cultural Organization (UNESCO) Institute for Statistics.
Categorie:
Education, Gender
sono stati aggiornati
23 apr 2017 anni
Indicatori delle variazioni dei valori per anni
In media:
31.326
Minima:
28.206
1 gen 2007 anni
Massimo:
32.985
1 gen 2014 anni
Alla data di osservazione
Valore
Variazione assoluta
La variazione rispetto al valore precedente
1 gen 2007 anni
28.206
+28.206
0.0%
1 gen 2009 anni
29.387
+1.182
4.19%
1 gen 2010 anni
30.618
+1.231
4.19%
1 gen 2011 anni
31.74
+1.123
3.67%
1 gen 2012 anni
32.156
+0.416
1.31%
1 gen 2013 anni
32.712
+0.556
1.73%
1 gen 2014 anni
32.985
+0.273
0.83%
1 gen 2015 anni
32.803
-0.182
-0.55%
Classificazione dei paesi secondo i statistiche attuali per anni