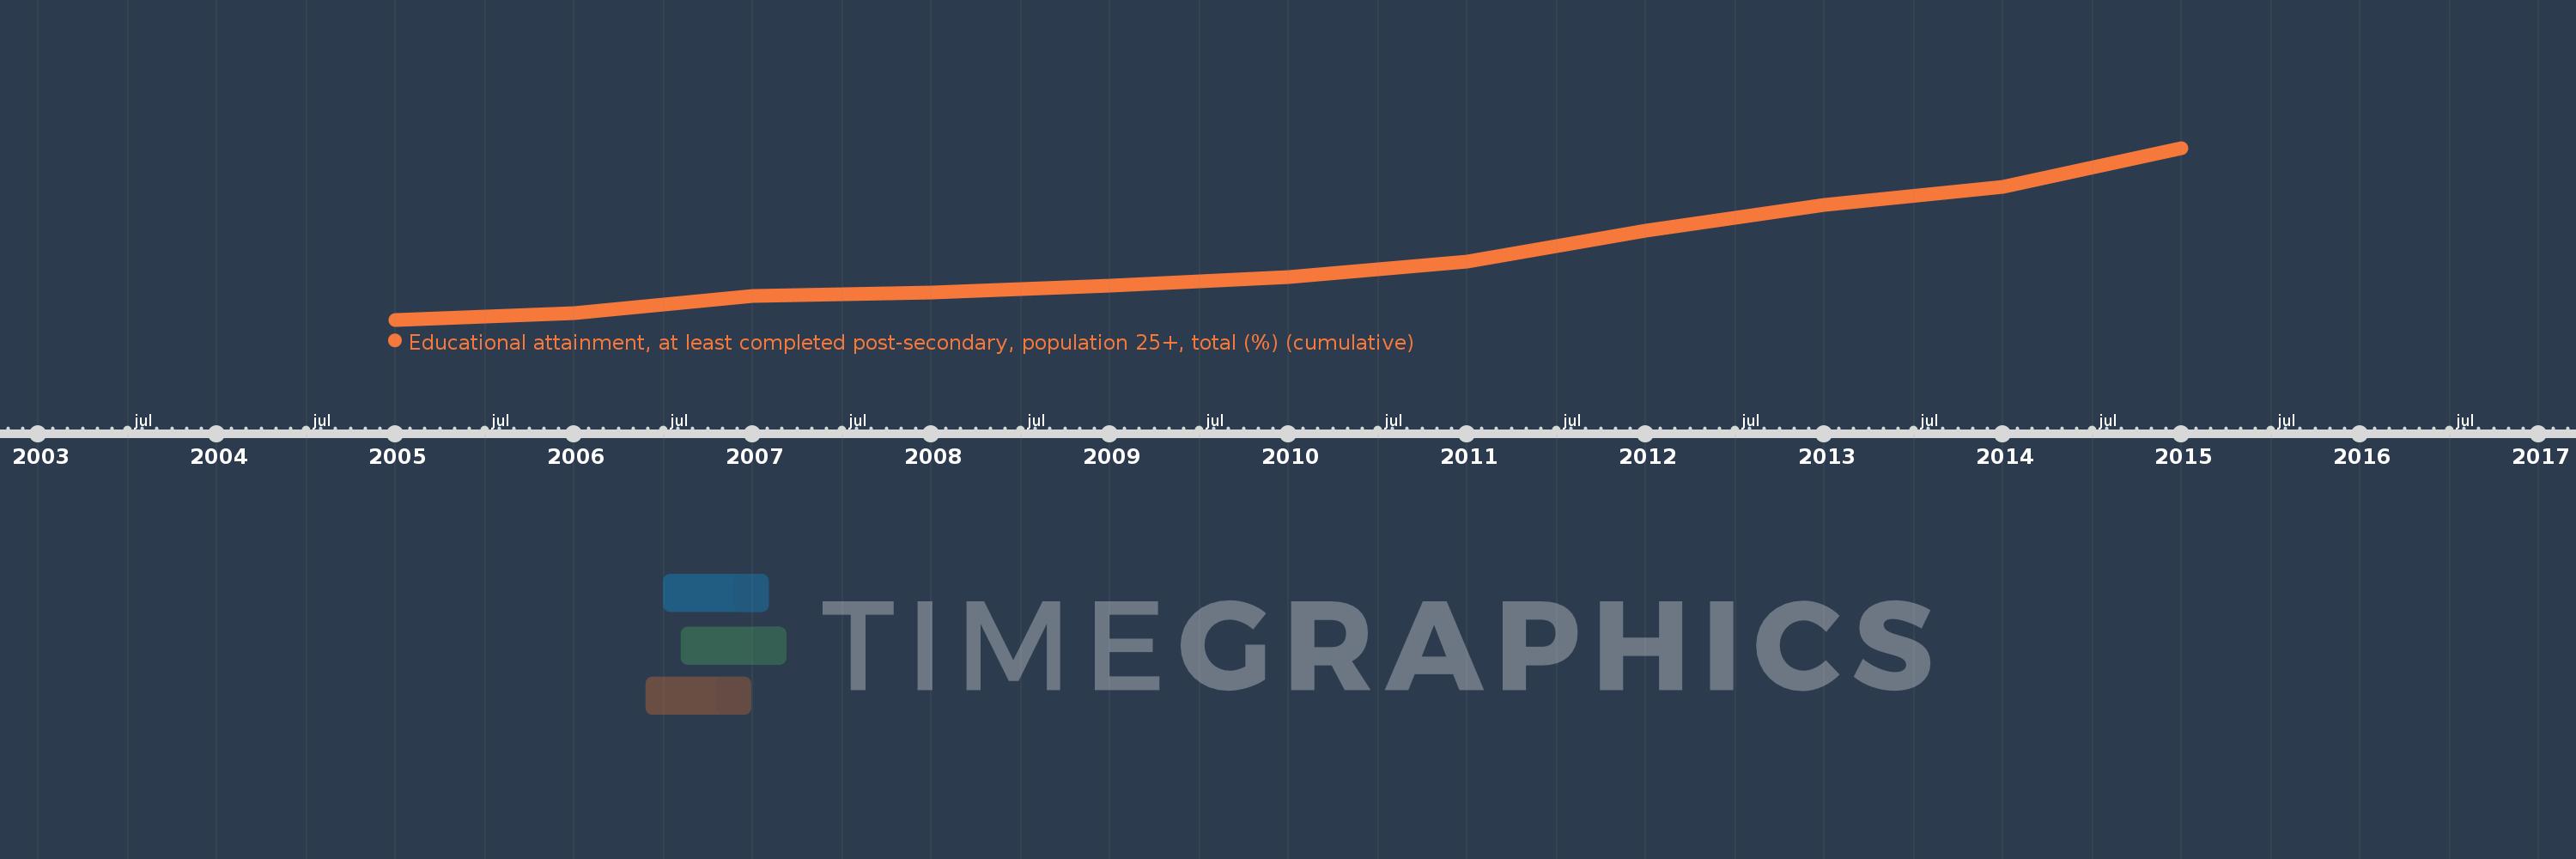
Questa scala temporale mostra un grafico dal 2005 anno al 2015 anno. Portugal. I dati fino ad 2004 anno non disponibili. Il numero di osservazioni attuali secondo i date: 11.
La fonte (nome):
Indicatori dello sviluppo mondiale
La fonte (organizzazione):
United Nations Educational, Scientific, and Cultural Organization (UNESCO) Institute for Statistics.
Categorie:
Education, Gender
sono stati aggiornati
23 apr 2017 anni
Indicatori delle variazioni dei valori per anni
In media:
13.379
Minima:
10.661
1 gen 2005 anni
Massimo:
17.977
1 gen 2015 anni
Alla data di osservazione
Valore
Variazione assoluta
La variazione rispetto al valore precedente
1 gen 2005 anni
10.661
+10.661
0.0%
1 gen 2006 anni
10.938
+0.277
2.6%
1 gen 2007 anni
11.676
+0.738
6.75%
1 gen 2008 anni
11.809
+0.133
1.14%
1 gen 2009 anni
12.128
+0.319
2.7%
1 gen 2010 anni
12.496
+0.368
3.04%
1 gen 2011 anni
13.155
+0.659
5.27%
1 gen 2012 anni
14.451
+1.295
9.85%
1 gen 2013 anni
15.56
+1.109
7.68%
1 gen 2014 anni
16.314
+0.754
4.85%
1 gen 2015 anni
17.977
+1.663
10.19%
Classificazione dei paesi secondo i statistiche attuali per anni