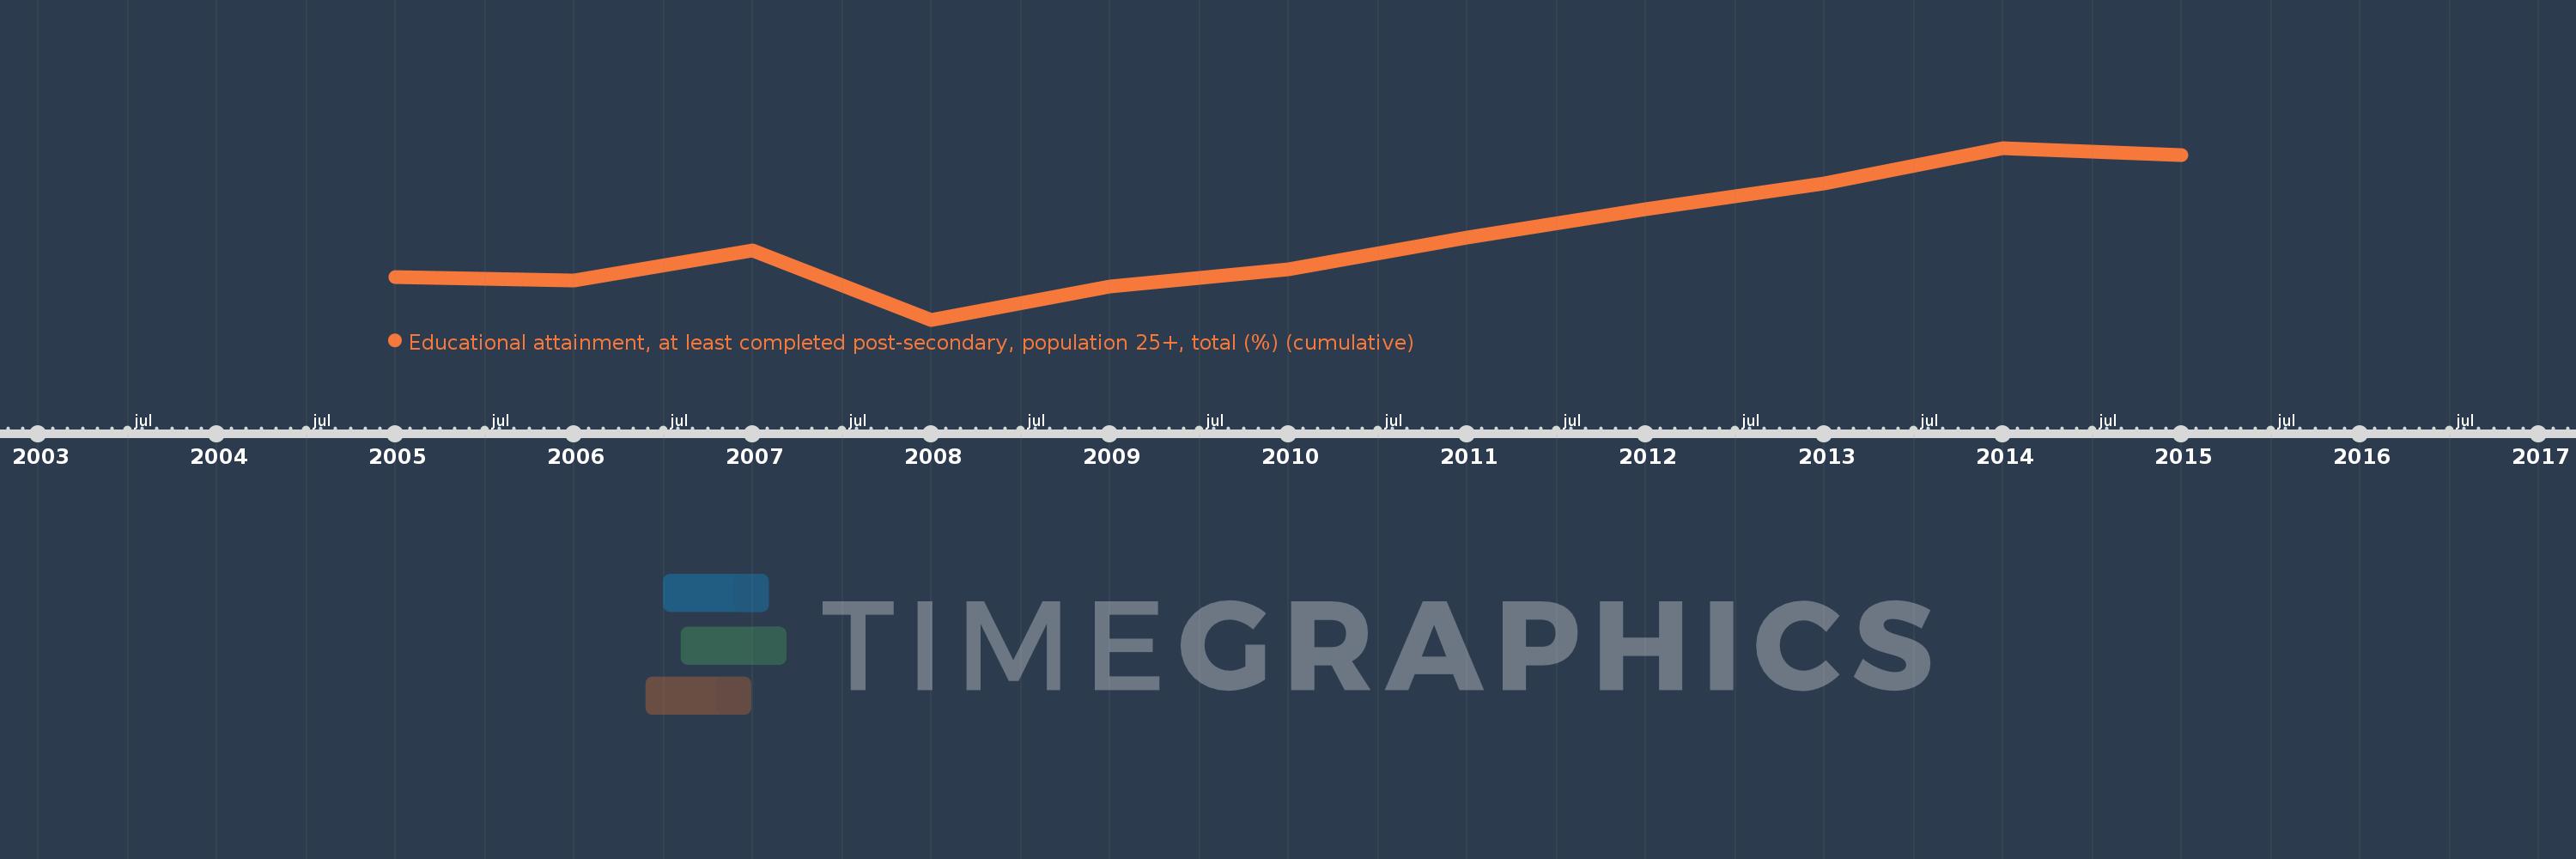
Questa scala temporale mostra un grafico dal 2005 anno al 2015 anno. Latvia. I dati fino ad 2004 anno non disponibili. Il numero di osservazioni attuali secondo i date: 11.
La fonte (nome):
Indicatori dello sviluppo mondiale
La fonte (organizzazione):
United Nations Educational, Scientific, and Cultural Organization (UNESCO) Institute for Statistics.
Categorie:
Education, Gender
sono stati aggiornati
23 apr 2017 anni
Indicatori delle variazioni dei valori per anni
In media:
32.634
Minima:
27.846
1 gen 2008 anni
Massimo:
37.898
1 gen 2014 anni
Alla data di osservazione
Valore
Variazione assoluta
La variazione rispetto al valore precedente
1 gen 2005 anni
30.348
+30.348
0.0%
1 gen 2006 anni
30.13
-0.218
-0.72%
1 gen 2007 anni
31.891
+1.761
5.85%
1 gen 2008 anni
27.846
-4.045
-12.68%
1 gen 2009 anni
29.796
+1.95
7.0%
1 gen 2010 anni
30.783
+0.986
3.31%
1 gen 2011 anni
32.678
+1.896
6.16%
1 gen 2012 anni
34.32
+1.642
5.02%
1 gen 2013 anni
35.807
+1.487
4.33%
1 gen 2014 anni
37.898
+2.091
5.84%
1 gen 2015 anni
37.472
-0.427
-1.13%
Classificazione dei paesi secondo i statistiche attuali per anni