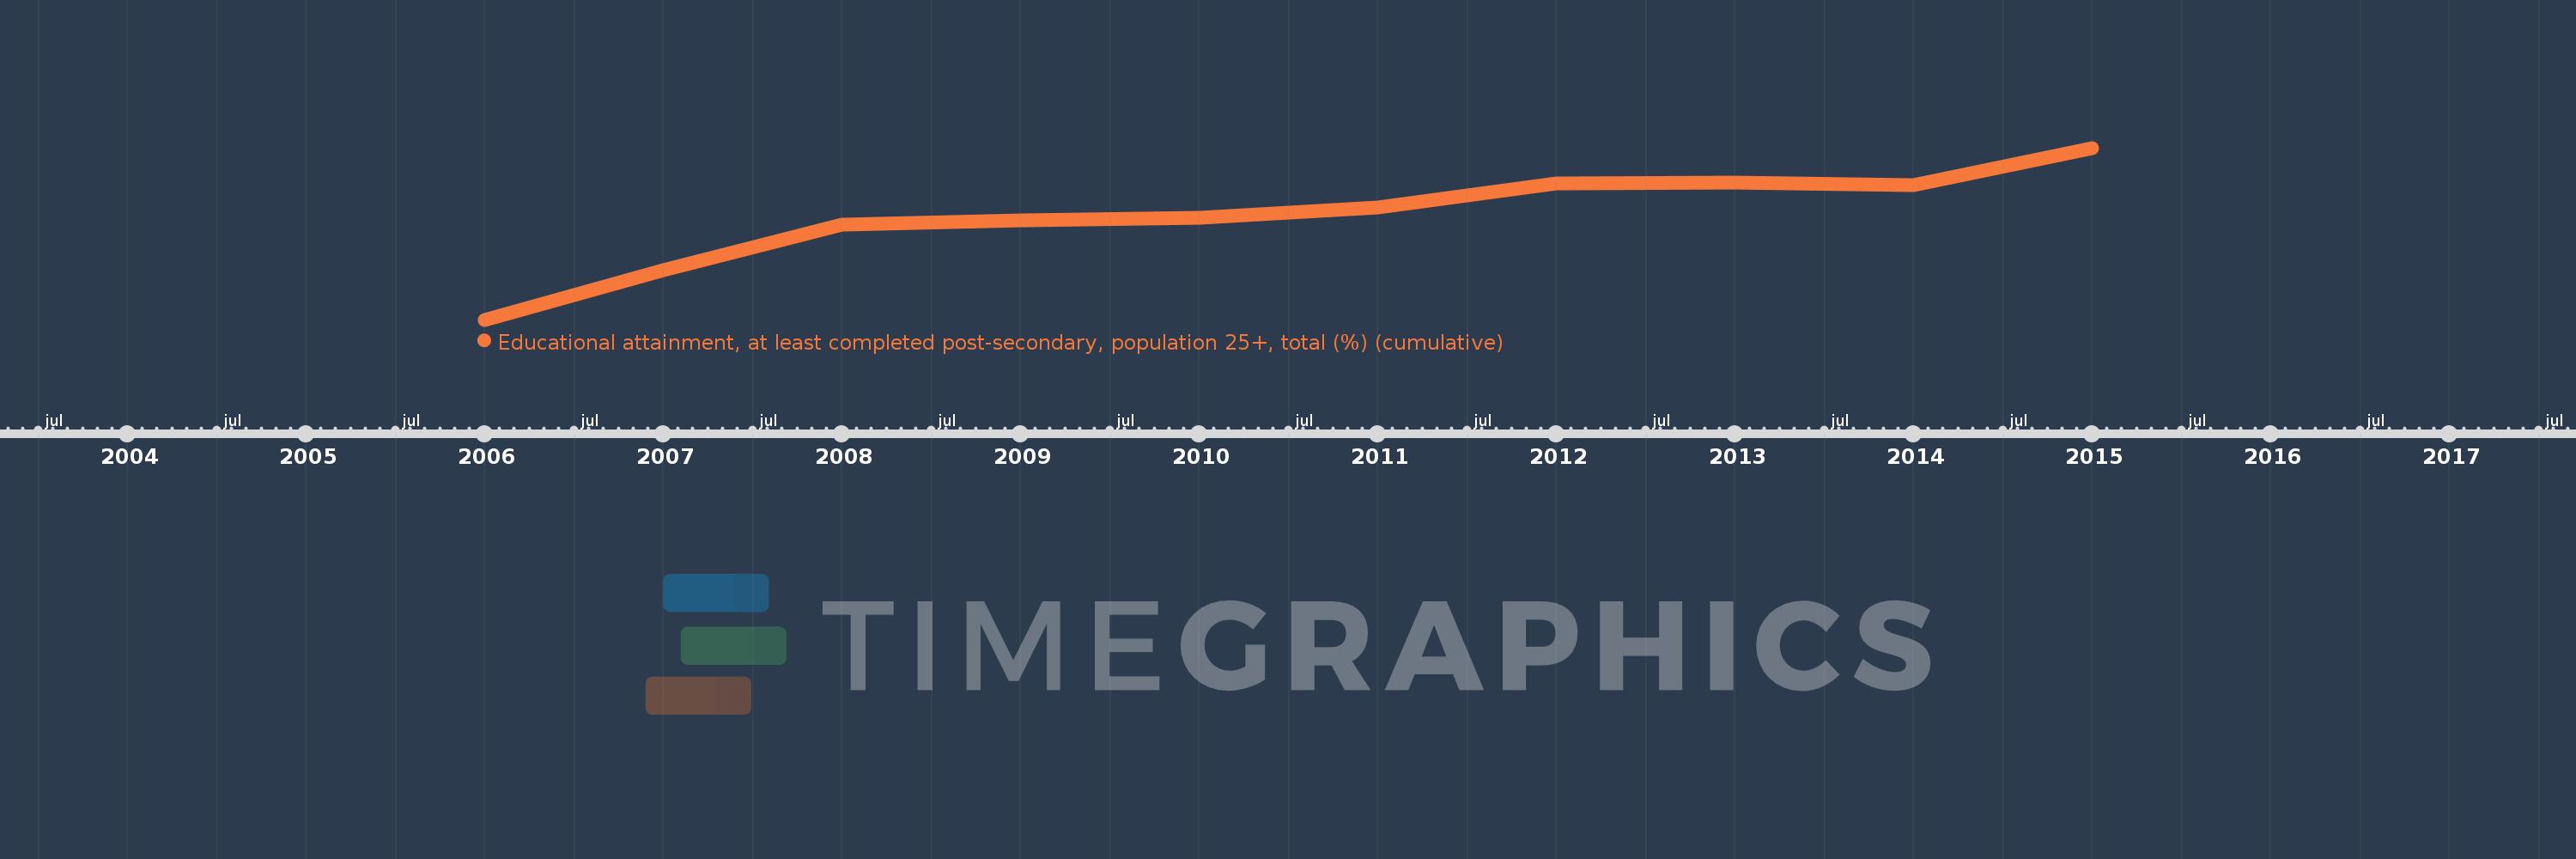
Questa scala temporale mostra un grafico dal 2006 anno al 2015 anno. Lithuania. I dati fino ad 2005 anno non disponibili. Il numero di osservazioni attuali secondo i date: 10.
La fonte (nome):
Indicatori dello sviluppo mondiale
La fonte (organizzazione):
United Nations Educational, Scientific, and Cultural Organization (UNESCO) Institute for Statistics.
Categorie:
Education, Gender
sono stati aggiornati
23 apr 2017 anni
Indicatori delle variazioni dei valori per anni
In media:
48.536
Minima:
44.957
1 gen 2006 anni
Massimo:
50.886
1 gen 2015 anni
Alla data di osservazione
Valore
Variazione assoluta
La variazione rispetto al valore precedente
1 gen 2006 anni
44.957
+44.957
0.0%
1 gen 2007 anni
46.66
+1.703
3.79%
1 gen 2008 anni
48.226
+1.566
3.36%
1 gen 2009 anni
48.388
+0.163
0.34%
1 gen 2010 anni
48.482
+0.093
0.19%
1 gen 2011 anni
48.834
+0.352
0.73%
1 gen 2012 anni
49.65
+0.816
1.67%
1 gen 2013 anni
49.689
+0.039
0.08%
1 gen 2014 anni
49.591
-0.098
-0.2%
1 gen 2015 anni
50.886
+1.295
2.61%
Classificazione dei paesi secondo i statistiche attuali per anni