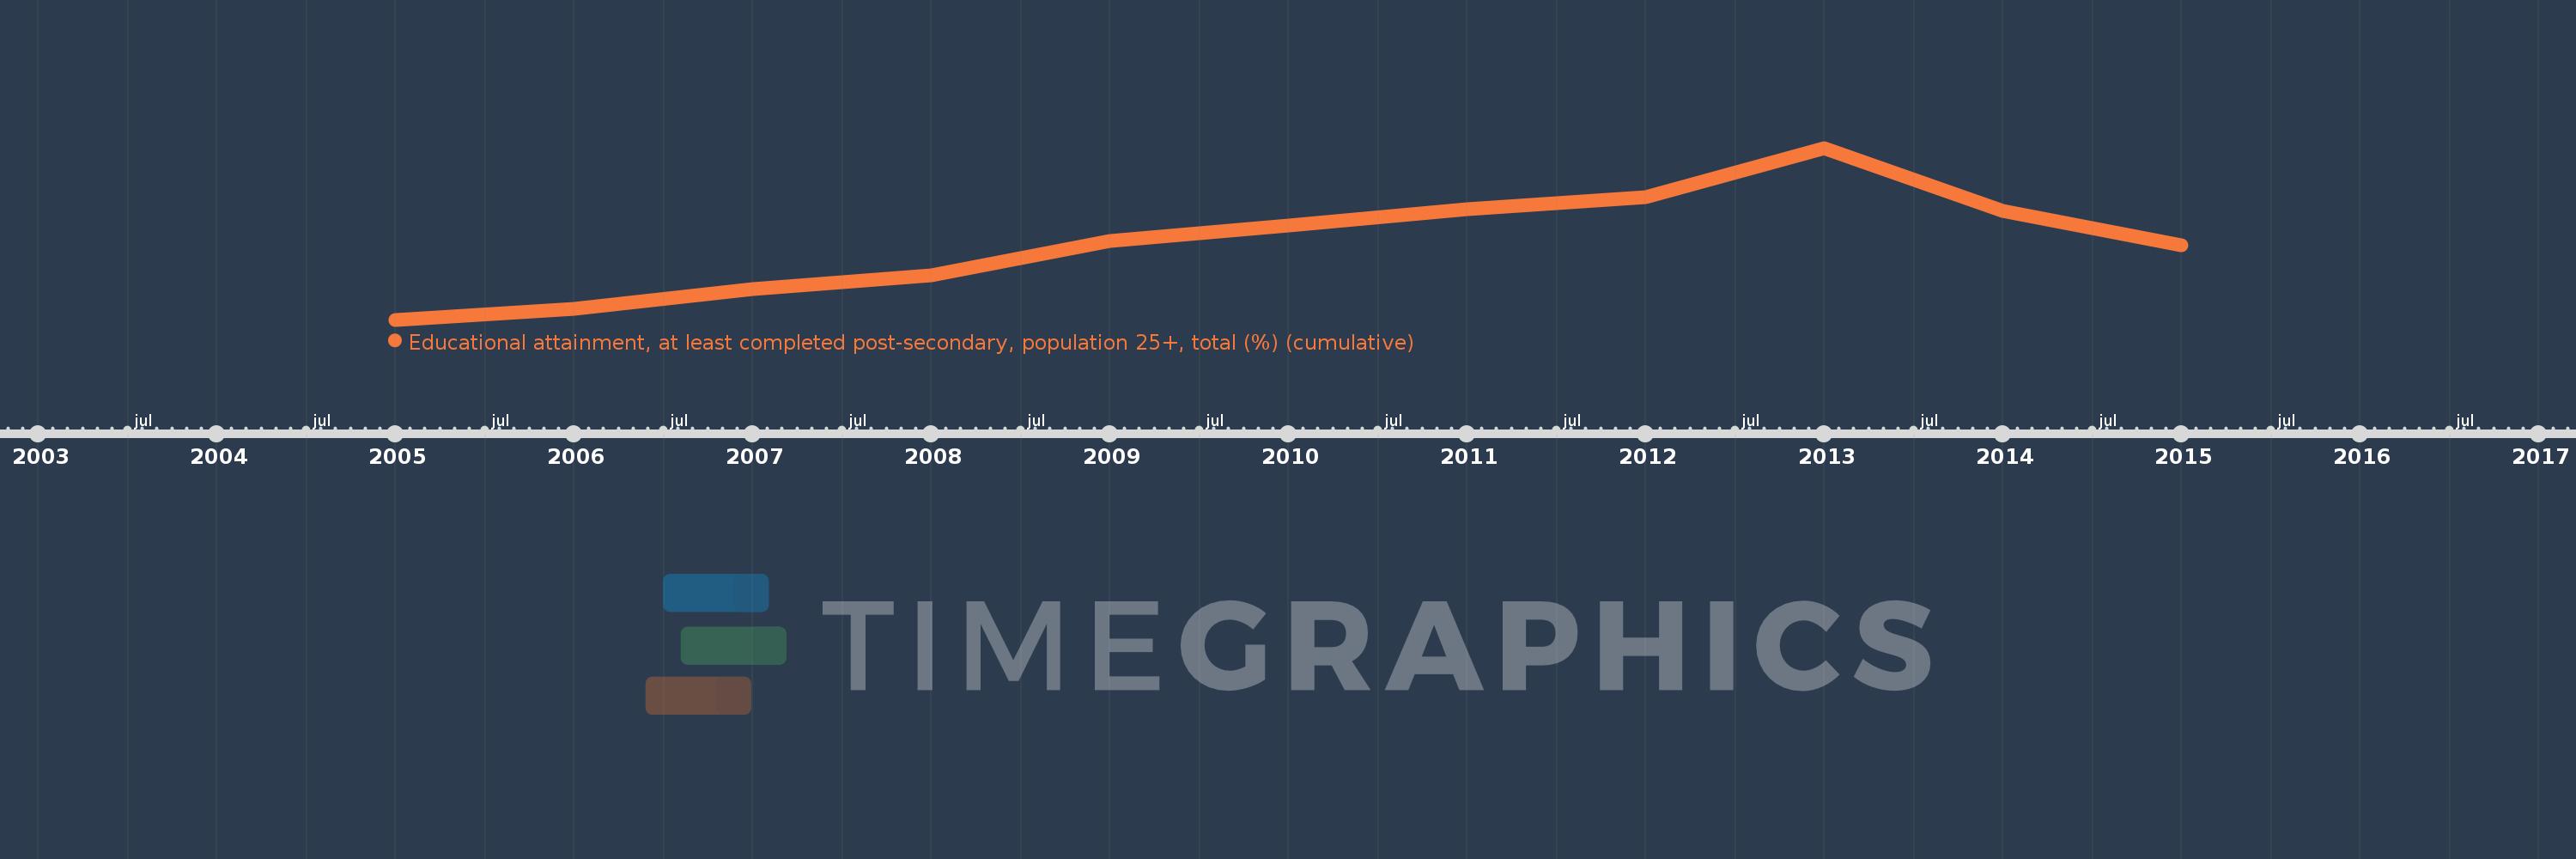
Questa scala temporale mostra un grafico dal 2005 anno al 2015 anno. Australia. I dati fino ad 2004 anno non disponibili. Il numero di osservazioni attuali secondo i date: 11.
La fonte (nome):
Indicatori dello sviluppo mondiale
La fonte (organizzazione):
United Nations Educational, Scientific, and Cultural Organization (UNESCO) Institute for Statistics.
Categorie:
Education, Gender
sono stati aggiornati
23 apr 2017 anni
Indicatori delle variazioni dei valori per anni
In media:
39.235
Minima:
33.365
1 gen 2005 anni
Massimo:
46.462
1 gen 2013 anni
Alla data di osservazione
Valore
Variazione assoluta
La variazione rispetto al valore precedente
1 gen 2005 anni
33.365
+33.365
0.0%
1 gen 2006 anni
34.204
+0.84
2.52%
1 gen 2007 anni
35.73
+1.525
4.46%
1 gen 2008 anni
36.735
+1.005
2.81%
1 gen 2009 anni
39.357
+2.622
7.14%
1 gen 2010 anni
40.556
+1.199
3.05%
1 gen 2011 anni
41.796
+1.24
3.06%
1 gen 2012 anni
42.703
+0.907
2.17%
1 gen 2013 anni
46.462
+3.759
8.8%
1 gen 2014 anni
41.641
-4.821
-10.38%
1 gen 2015 anni
39.035
-2.606
-6.26%
Classificazione dei paesi secondo i statistiche attuali per anni