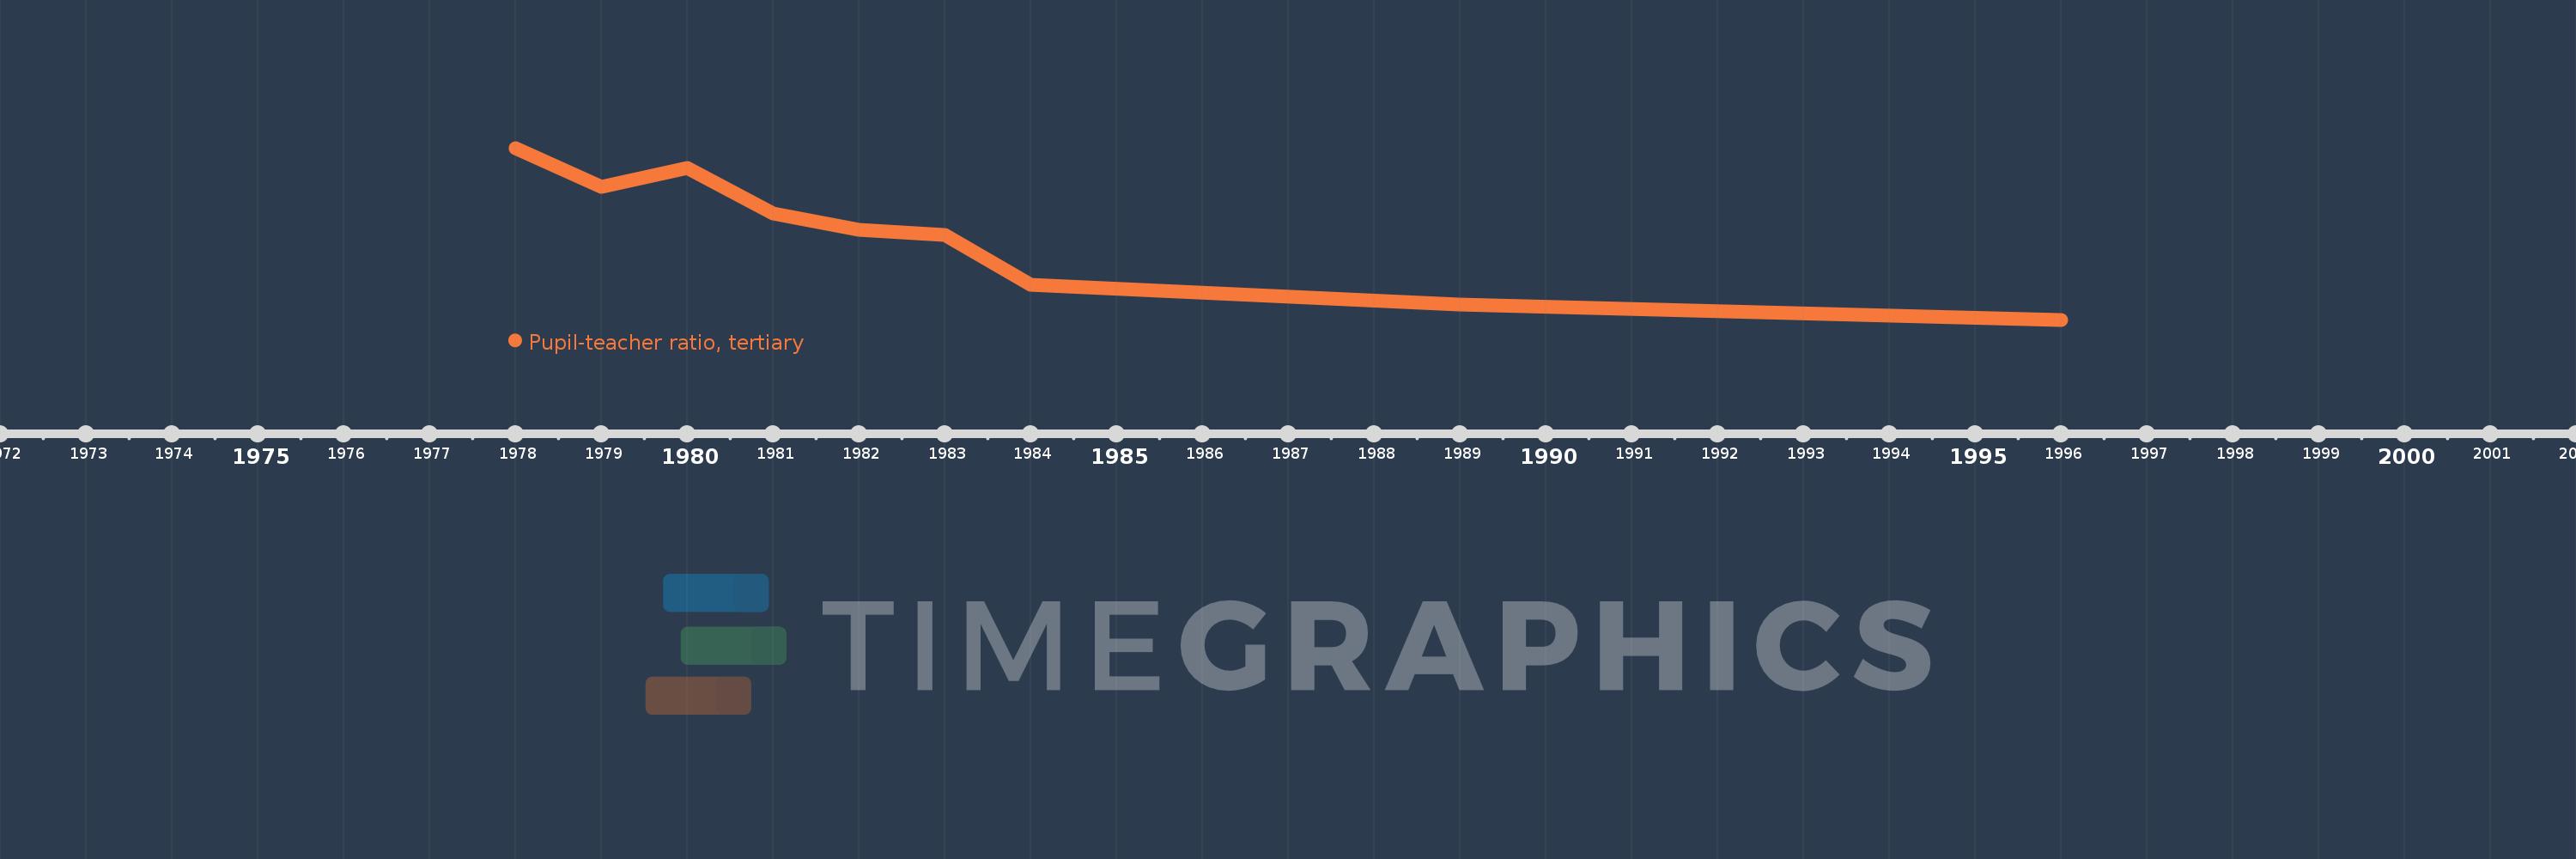
Questa scala temporale mostra un grafico dal 1978 anno al 1996 anno. Bahamas, The. I dati fino ad 1977 anno non disponibili. Il numero di osservazioni attuali secondo i date: 9.
La fonte (nome):
Indicatori dello sviluppo mondiale
La fonte (organizzazione):
United Nations Educational, Scientific, and Cultural Organization (UNESCO) Institute for Statistics.
Categorie:
Education
sono stati aggiornati
23 apr 2017 anni
Indicatori delle variazioni dei valori per anni
In media:
31.872
Minima:
19.038
1 gen 1996 anni
Massimo:
44.219
1 gen 1978 anni
Alla data di osservazione
Valore
Variazione assoluta
La variazione rispetto al valore precedente
1 gen 1978 anni
44.219
+44.219
0.0%
1 gen 1979 anni
38.569
-5.649
-12.78%
1 gen 1980 anni
41.228
+2.659
6.89%
1 gen 1981 anni
34.614
-6.614
-16.04%
1 gen 1982 anni
32.228
-2.386
-6.89%
1 gen 1983 anni
31.452
-0.776
-2.41%
1 gen 1984 anni
24.195
-7.257
-23.07%
1 gen 1989 anni
21.305
-2.89
-11.94%
1 gen 1996 anni
19.038
-2.267
-10.64%
Classificazione dei paesi secondo i statistiche attuali per anni