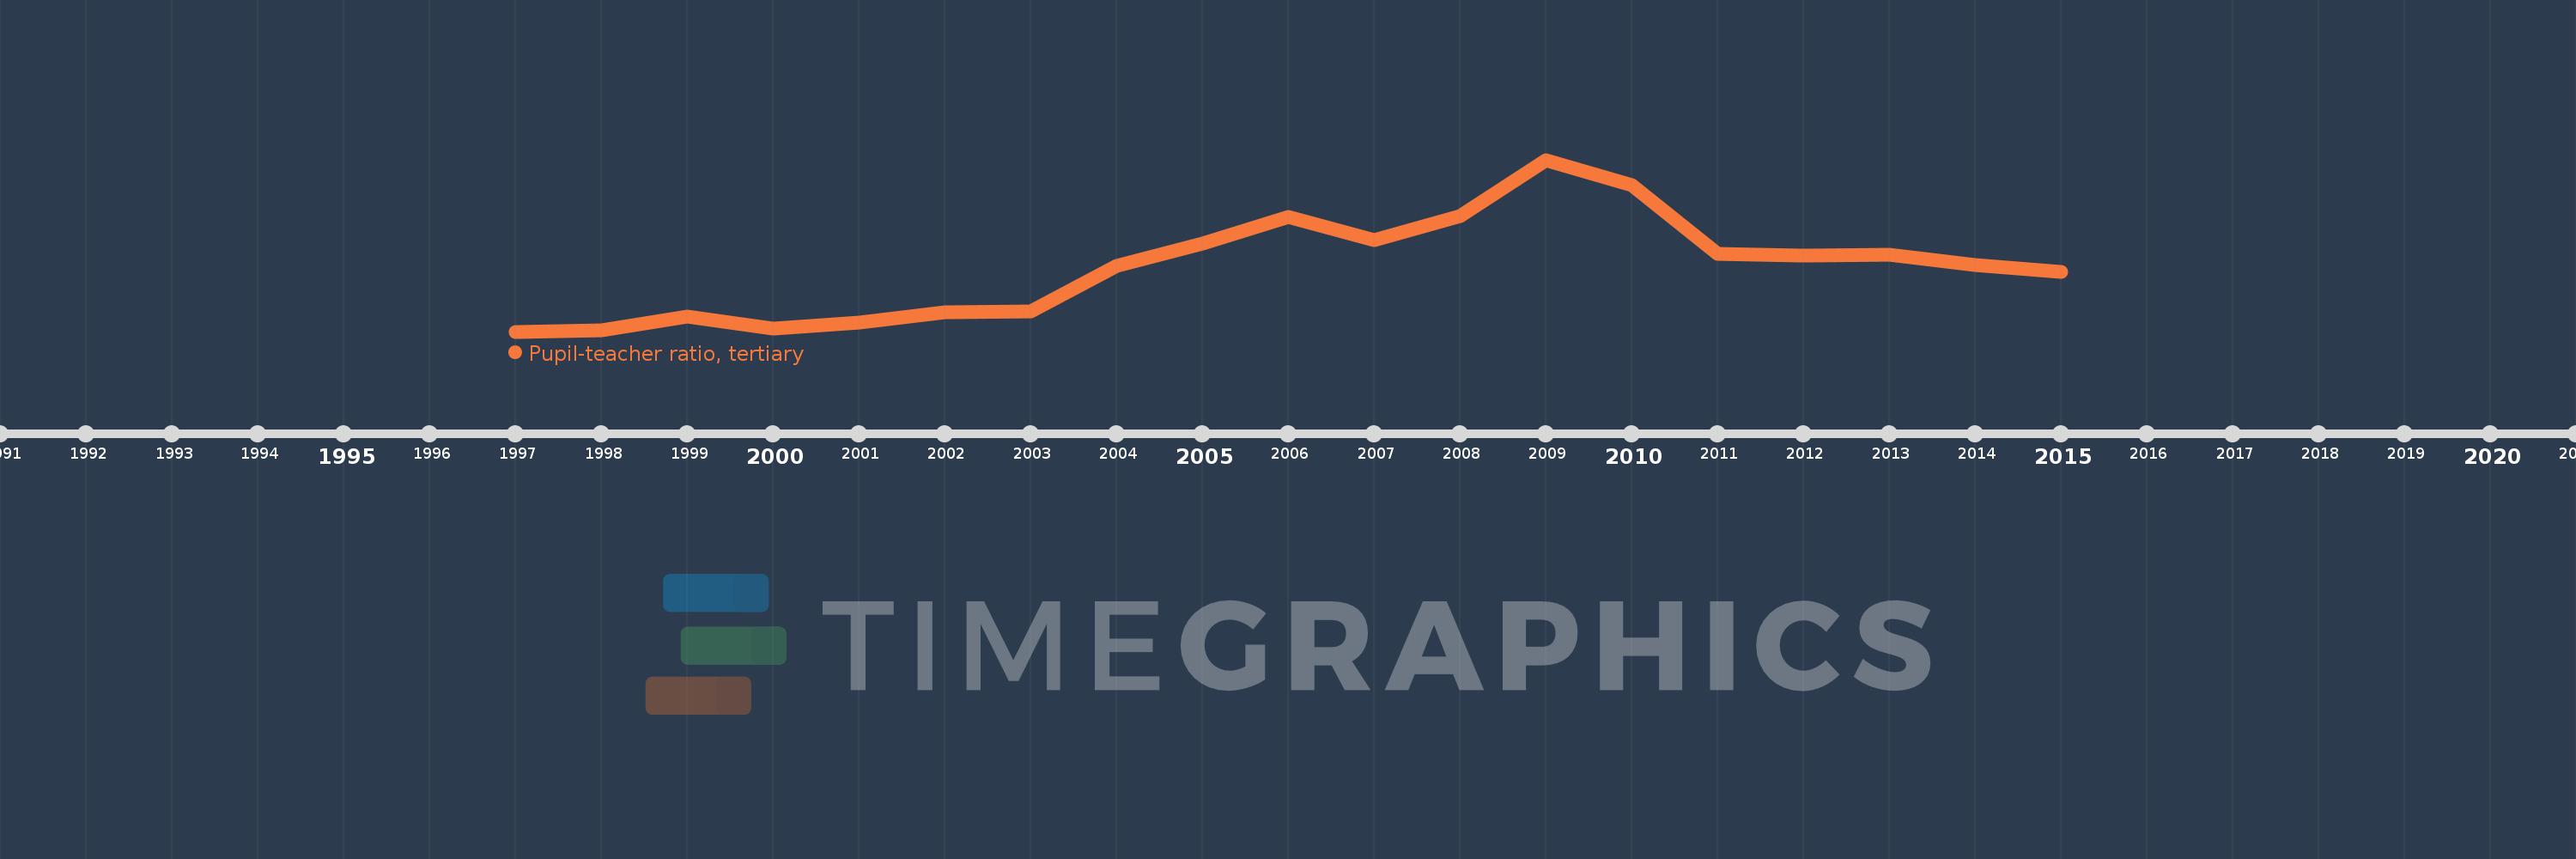
Questa scala temporale mostra un grafico dal 1997 anno al 2015 anno. West Bank and Gaza. I dati fino ad 1996 anno non disponibili. Il numero di osservazioni attuali secondo i date: 19.
La fonte (nome):
Indicatori dello sviluppo mondiale
La fonte (organizzazione):
United Nations Educational, Scientific, and Cultural Organization (UNESCO) Institute for Statistics.
Categorie:
Education
sono stati aggiornati
23 apr 2017 anni
Indicatori delle variazioni dei valori per anni
In media:
25.967
Minima:
20.195
1 gen 1997 anni
Massimo:
35.653
1 gen 2009 anni
Alla data di osservazione
Valore
Variazione assoluta
La variazione rispetto al valore precedente
1 gen 1997 anni
20.195
+20.195
0.0%
1 gen 1998 anni
20.302
+0.107
0.53%
1 gen 1999 anni
21.536
+1.234
6.08%
1 gen 2000 anni
20.47
-1.066
-4.95%
1 gen 2001 anni
21.005
+0.535
2.61%
1 gen 2002 anni
21.964
+0.959
4.57%
1 gen 2003 anni
21.985
+0.021
0.1%
1 gen 2004 anni
26.083
+4.098
18.64%
1 gen 2005 anni
28.107
+2.024
7.76%
1 gen 2006 anni
30.521
+2.414
8.59%
1 gen 2007 anni
28.449
-2.072
-6.79%
1 gen 2008 anni
30.628
+2.179
7.66%
1 gen 2009 anni
35.653
+5.025
16.41%
1 gen 2010 anni
33.4
-2.253
-6.32%
1 gen 2011 anni
27.188
-6.212
-18.6%
1 gen 2012 anni
27.048
-0.141
-0.52%
1 gen 2013 anni
27.127
+0.079
0.29%
1 gen 2014 anni
26.174
-0.952
-3.51%
1 gen 2015 anni
25.535
-0.639
-2.44%
Classificazione dei paesi secondo i statistiche attuali per anni