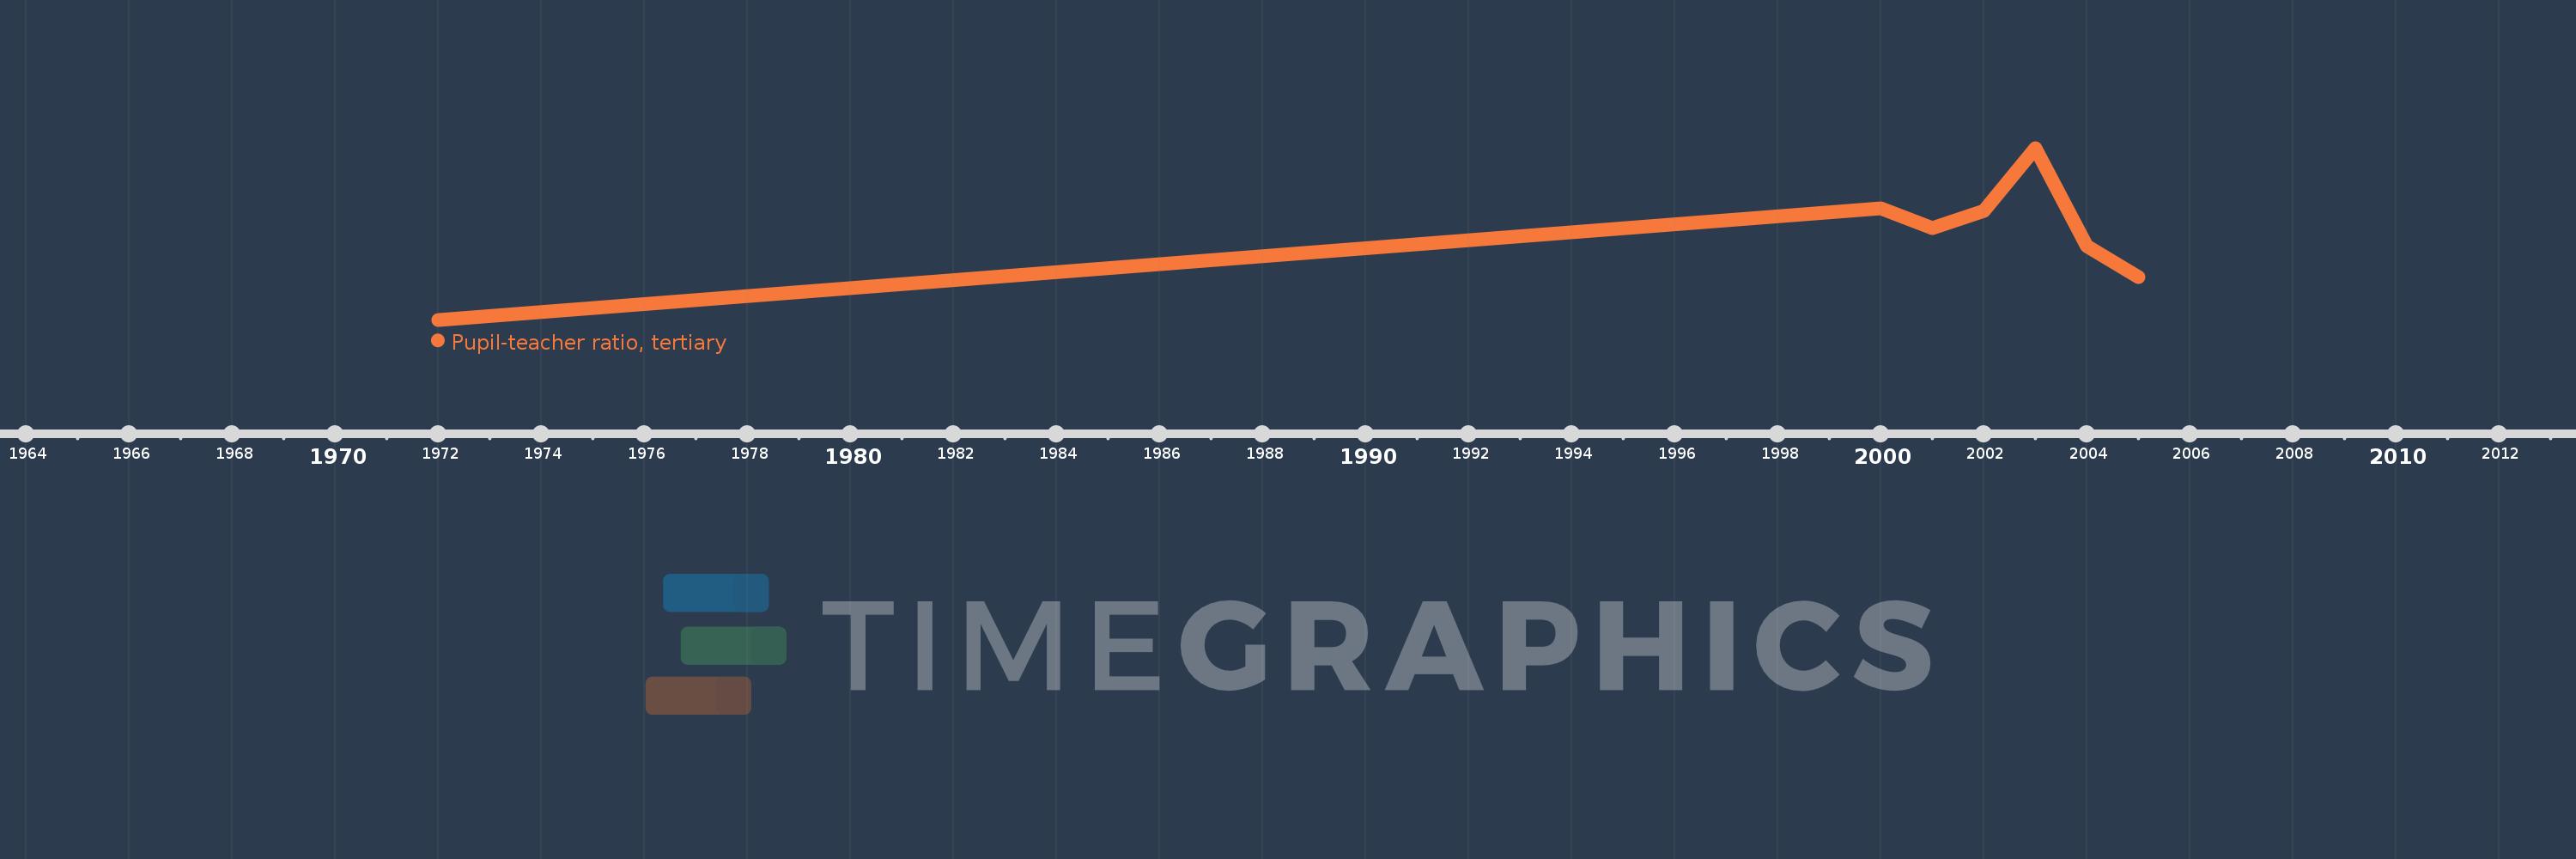
Questa scala temporale mostra un grafico dal 1972 anno al 2005 anno. Trinidad and Tobago. I dati fino ad 1971 anno non disponibili. Il numero di osservazioni attuali secondo i date: 7.
La fonte (nome):
Indicatori dello sviluppo mondiale
La fonte (organizzazione):
United Nations Educational, Scientific, and Cultural Organization (UNESCO) Institute for Statistics.
Categorie:
Education
sono stati aggiornati
23 apr 2017 anni
Indicatori delle variazioni dei valori per anni
In media:
13.799
Minima:
5.765
1 gen 1972 anni
Massimo:
21.884
1 gen 2003 anni
Alla data di osservazione
Valore
Variazione assoluta
La variazione rispetto al valore precedente
1 gen 1972 anni
5.765
+5.765
0.0%
1 gen 2000 anni
16.214
+10.45
181.27%
1 gen 2001 anni
14.328
-1.886
-11.63%
1 gen 2002 anni
15.952
+1.624
11.34%
1 gen 2003 anni
21.884
+5.932
37.19%
1 gen 2004 anni
12.71
-9.174
-41.92%
1 gen 2005 anni
9.739
-2.971
-23.38%
Classificazione dei paesi secondo i statistiche attuali per anni