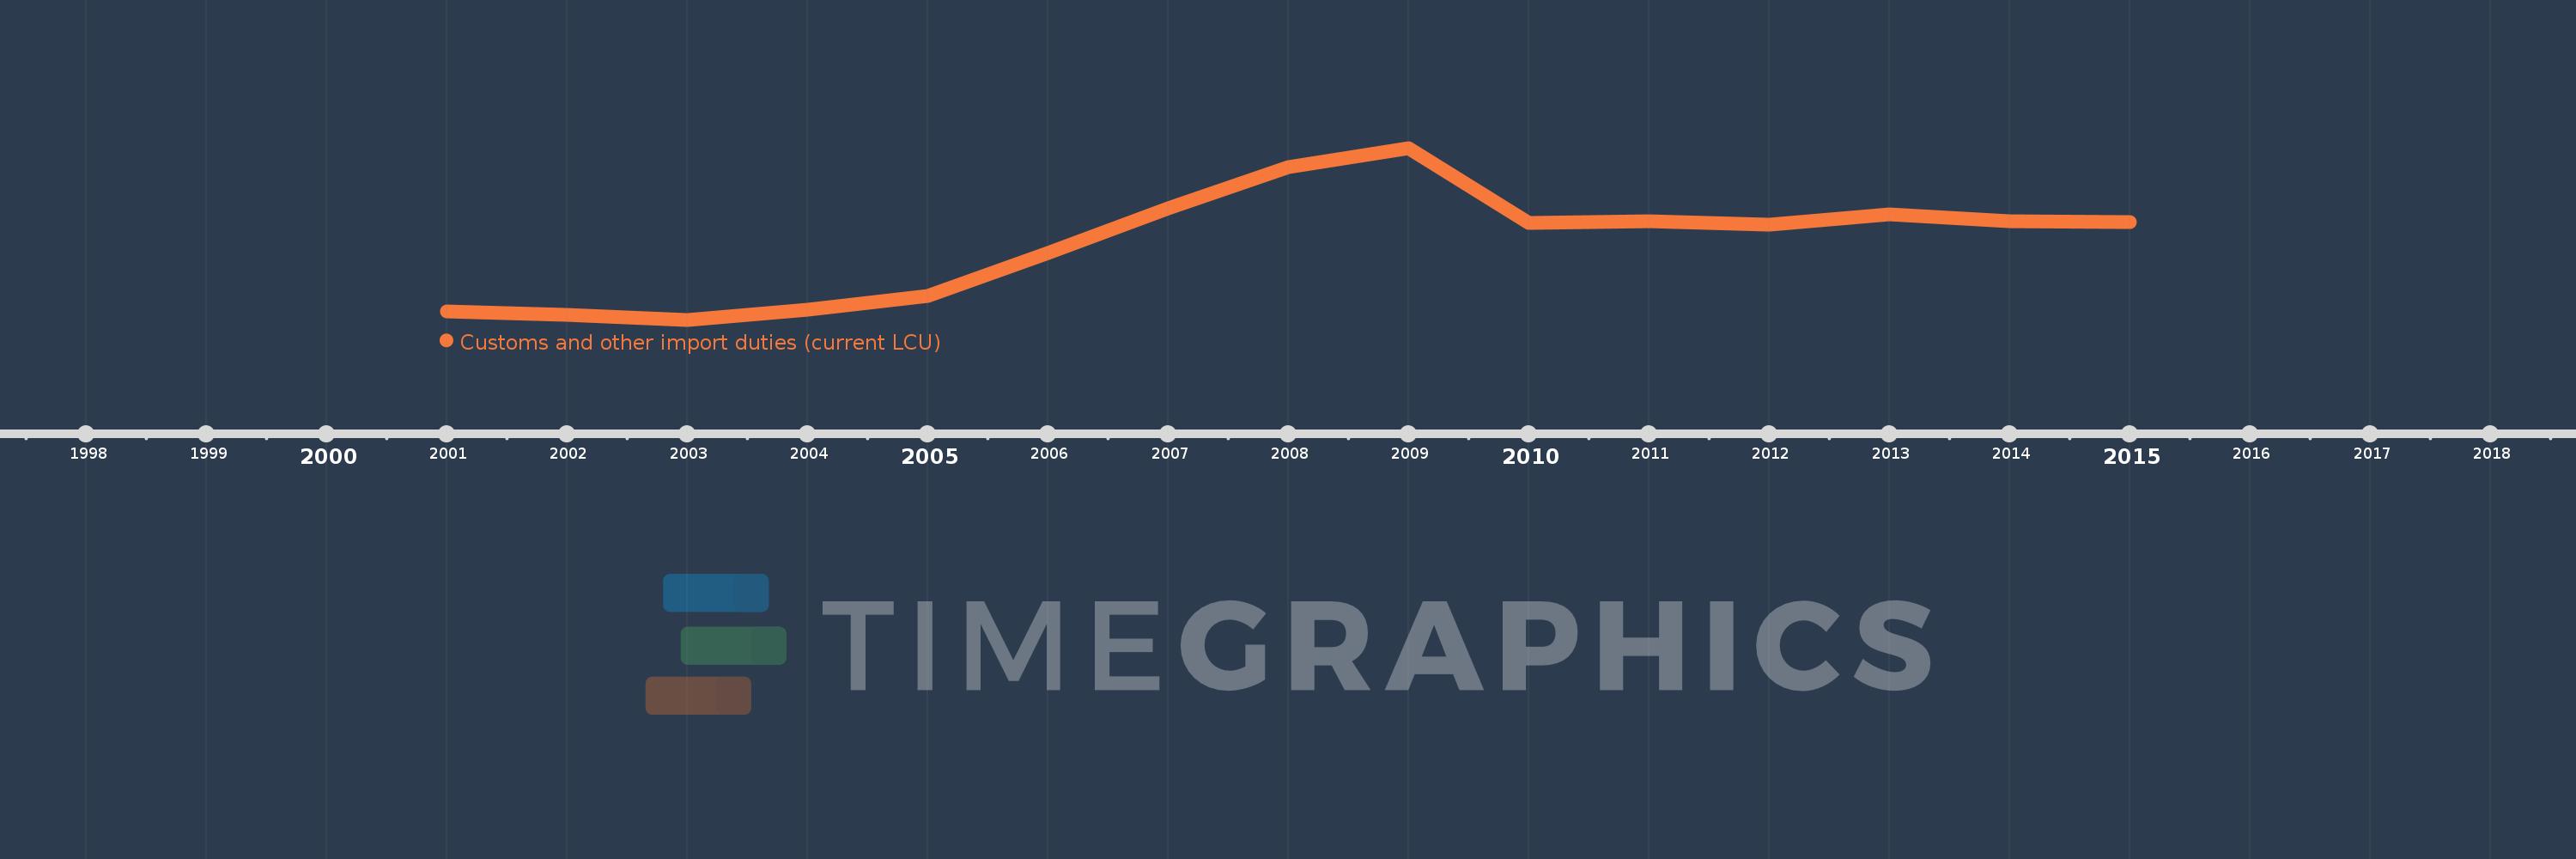
Questa scala temporale mostra un grafico dal 2001 anno al 2015 anno. Antigua and Barbuda. I dati fino ad 2000 anno non disponibili. Il numero di osservazioni attuali secondo i date: 15.
La fonte (nome):
Indicatori dello sviluppo mondiale
La fonte (organizzazione):
International Monetary Fund, Government Finance Statistics Yearbook and data files.
Categorie:
Public Sector
sono stati aggiornati
23 apr 2017 anni
Indicatori delle variazioni dei valori per anni
In media:
73.592 Mln
Minima:
54.56 Mln
1 gen 2003 anni
Massimo:
97.523 Mln
1 gen 2009 anni
Alla data di osservazione
Valore
Variazione assoluta
La variazione rispetto al valore precedente
1 gen 2001 anni
56.69 Mln
+56.69 Mln
0.0%
1 gen 2002 anni
55.88 Mln
-810.0 Mille.
-1.43%
1 gen 2003 anni
54.56 Mln
-1.32 Mln
-2.36%
1 gen 2004 anni
56.977 Mln
+2.417 Mln
4.43%
1 gen 2005 anni
60.481 Mln
+3.504 Mln
6.15%
1 gen 2006 anni
71.187 Mln
+10.706 Mln
17.7%
1 gen 2007 anni
82.328 Mln
+11.141 Mln
15.65%
1 gen 2008 anni
92.643 Mln
+10.315 Mln
12.53%
1 gen 2009 anni
97.523 Mln
+4.88 Mln
5.27%
1 gen 2010 anni
78.874 Mln
-18.65 Mln
-19.12%
1 gen 2011 anni
79.135 Mln
+260.932 Mille.
0.33%
1 gen 2012 anni
78.372 Mln
-762.742 Mille.
-0.96%
1 gen 2013 anni
81.021 Mln
+2.649 Mln
3.38%
1 gen 2014 anni
79.133 Mln
-1.888 Mln
-2.33%
1 gen 2015 anni
79.073 Mln
-59.726 Mille.
-0.08%
Classificazione dei paesi secondo i statistiche attuali per anni