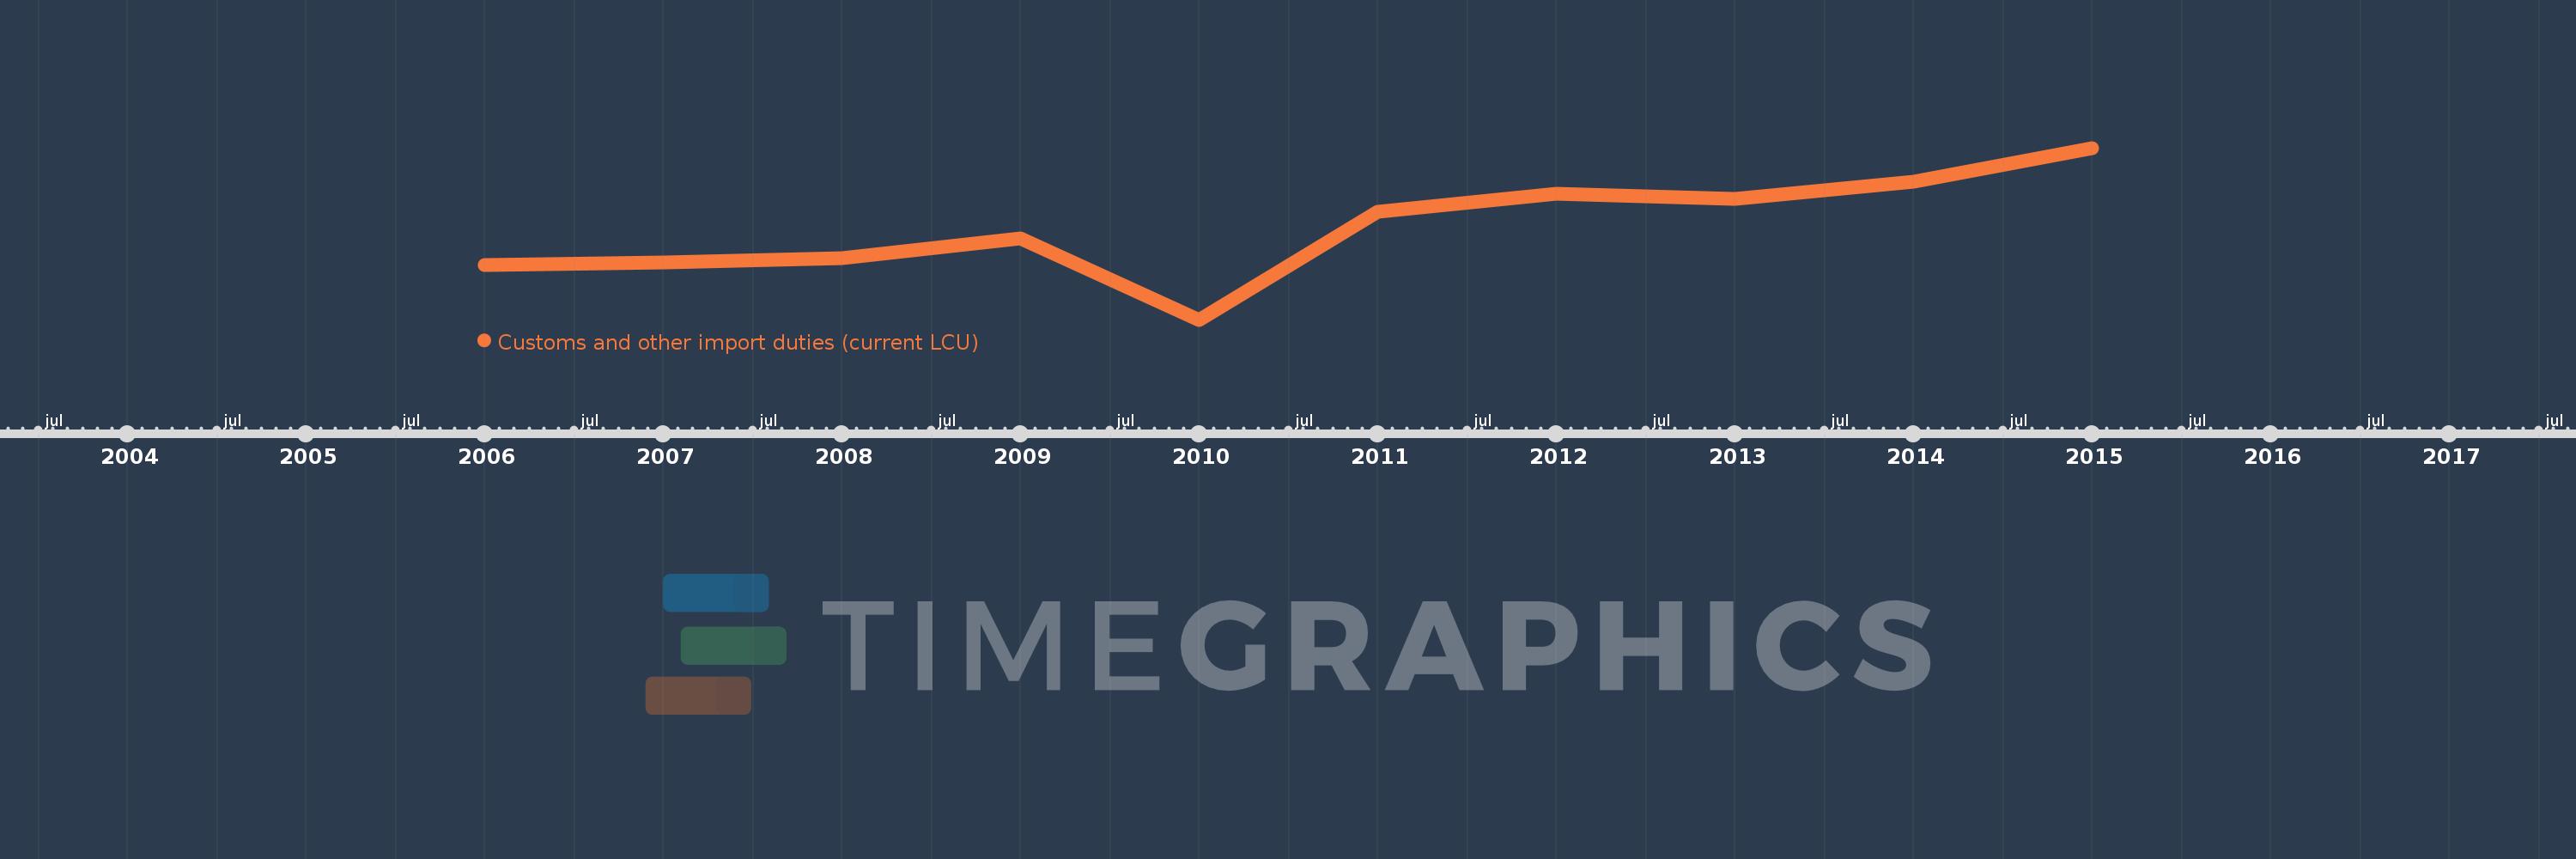
Questa scala temporale mostra un grafico dal 2006 anno al 2015 anno. West Bank and Gaza. I dati fino ad 2005 anno non disponibili. Il numero di osservazioni attuali secondo i date: 10.
La fonte (nome):
Indicatori dello sviluppo mondiale
La fonte (organizzazione):
International Monetary Fund, Government Finance Statistics Yearbook and data files.
Categorie:
Public Sector
sono stati aggiornati
23 apr 2017 anni
Indicatori delle variazioni dei valori per anni
In media:
425.36 Mln
Minima:
20.864 Mln
1 gen 2010 anni
Massimo:
776.015 Mln
1 gen 2015 anni
Alla data di osservazione
Valore
Variazione assoluta
La variazione rispetto al valore precedente
1 gen 2006 anni
261.889 Mln
+261.889 Mln
0.0%
1 gen 2007 anni
271.0 Mln
+9.111 Mln
3.48%
1 gen 2008 anni
293.0 Mln
+22.0 Mln
8.12%
1 gen 2009 anni
378.295 Mln
+85.295 Mln
29.11%
1 gen 2010 anni
20.864 Mln
-357.43 Mln
-94.48%
1 gen 2011 anni
497.133 Mln
+476.268 Mln
2.28 Mille.%
1 gen 2012 anni
573.983 Mln
+76.85 Mln
15.46%
1 gen 2013 anni
553.887 Mln
-20.095 Mln
-3.5%
1 gen 2014 anni
627.535 Mln
+73.648 Mln
13.3%
1 gen 2015 anni
776.015 Mln
+148.48 Mln
23.66%
Classificazione dei paesi secondo i statistiche attuali per anni